Fig. 2.
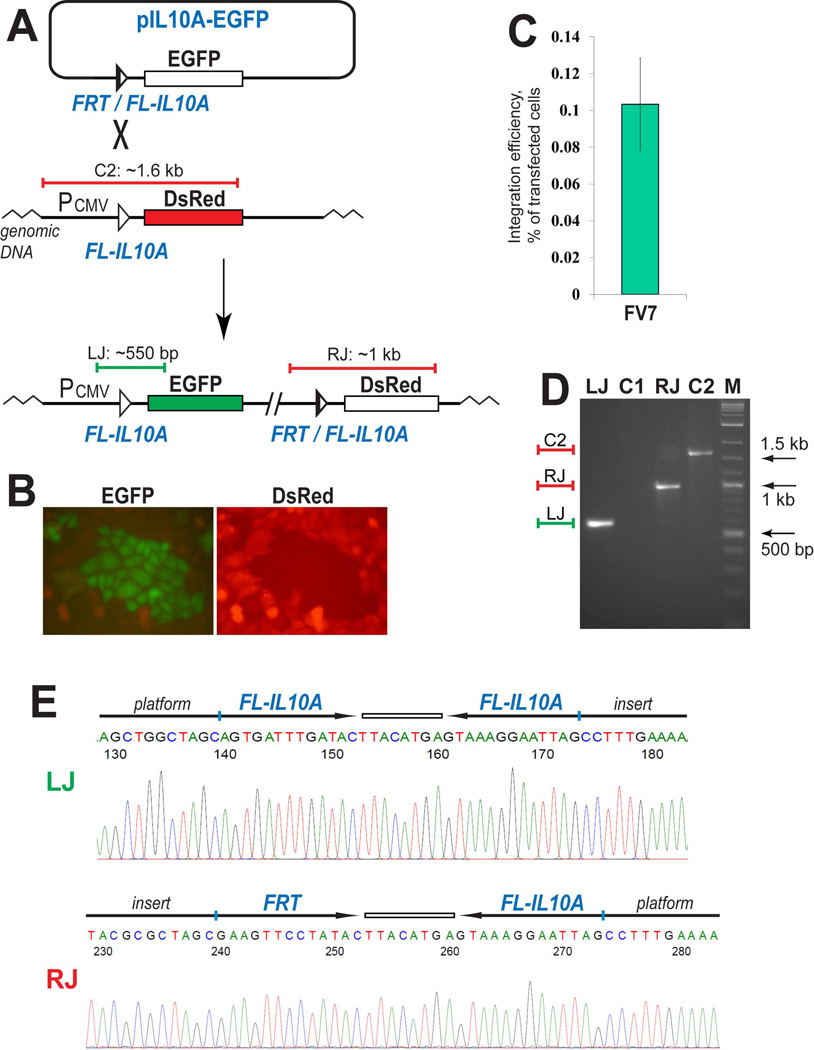
FV7-mediated integration of a reporter into FL-IL10A pre-integrated into the CHO genome. (A) Schematic outline of the integration assay. The horizontal blue and red bars in panels (A) and (D) schematically represent the PCR products at the left junction [LJ] and the right junction [RJ] of the integration product and the control PCR product of the platform reporter [C2]. (B) Green colonies are formed after the transfected cells are split and expanded. (C) The efficiency of the FV7-dependent integration is represented by the green bar that shows the mean value of three experiments; the error bar indicates standard deviation. (D) PCR analyses of a typical expanded green colony. LJ and C1 lanes show the results of the PCR analysis of the green cells and the original platform cells, respectively, using the same primers that anneal on the CMV promoter and the EGFP gene. RJ and C2, the PCR analysis of the green cells and the control platform cells using the primers that anneal on the vector backbone and the DsRed gene. M, DNA marker. (E) Representative sequencing snapshots of the recombination site regions in the diagnostic PCR products LJ and RJ (panel D). The schematics of the recombination sites and the surrounding sequences are shown above the sequencing snapshots.

