
Figure 6. Disruption of circadian homeostasis induces Leptin resistance in Wt mice.
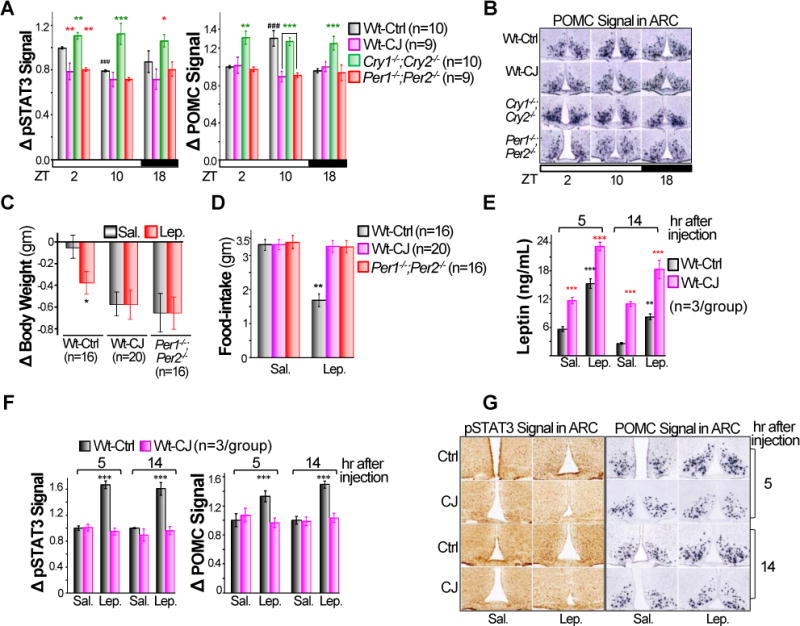
A. A summary of pSTAT3 signals detected by immunohistochemistry (IHC) (left) and POMC signal detected by in situ (right) in ARC of control Wt, Cry1−/−;Cry2−/− and Per1−/−;Per2−/− mice and jet-lagged Wt mice, with signals detected in the ARC of control Wt mice at ZT2 as arbitrary unit 1 (±SEM). B. Representative POMC in situ images in ARC of mice described in A. Changes in body weight (C) and food-intake (D) of control Wt and Per1−/−;Per2−/− mice and jet-lagged Wt mice over a 24hr period in response to a single intraperitoneal injection of recombinant mouse Leptin (±SEM). E. The serum levels of Leptin at 5 and 14hr after a single injection of exogenous Leptin in control and jet-lagged Wt mice (±SEM). F. A summary of pSTAT3 (left) and POMC (right) signals in the ARC of control and jet-lagged Wt mice at 5 and 14hr after a single administration of exogenous Leptin, with signals detected in the ARC of saline injected control Wt mice at 5hr after the injection as arbitrary unit 1 (±SEM). G. Representative pSTAT3 IHC (left) and POMC in situ (right) images in the ARC of Wt control and jet-lagged mice after a single administration of exogenous Leptin. *: Compare to control Wt samples at the same time in A and B, or control Wt mice injected with Saline in C–F. #: Compare to Wt samples at ZT2 in A and B; *p < 0.05, **p < 0.01 and ***/###p < 0.001. See also Figure S7.