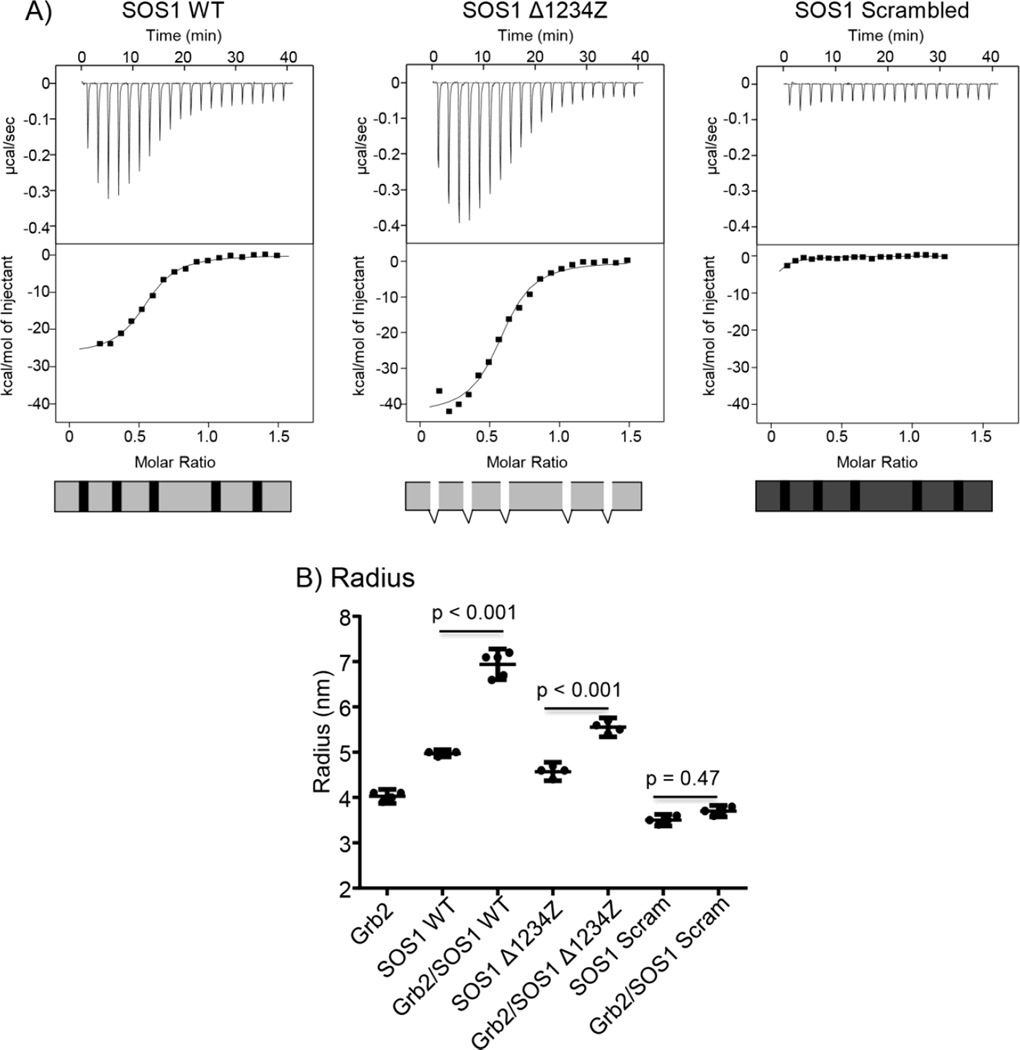
Figure 4. Regions outside of the consensus PxxPxR motifs are required for the high affinity interaction of GRB2 with SOS1.
A) Raw ITC tracings for the interaction of GRB2 with SOS1 WT, SOS1 Δ1234Z and SOS1 scrambled. Each trace is representative of at least 4 separate injections. B) The hydrodynamic radius of GRB2, SOS1 WT, SOS1 Δ1234Z or SOS1 scrambled, both alone and in combination, was determined using DLS. The individual values, with the mean ± 95% confidence intervals were plotted using GraphPad Prism. Statistical analysis was performed using GraphPad Prism via ANOVA analysis and the p values are shown.

