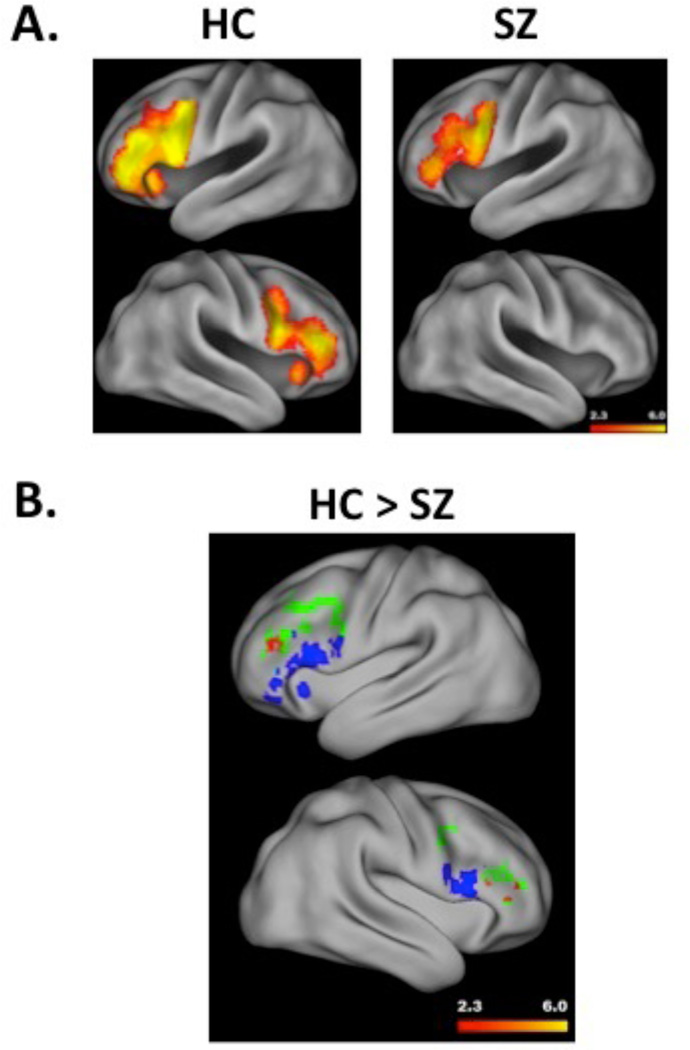
Figure 3.
Panel A illustrates a surface rendering of left (top) and right hemisphere (bottom) PFC activation during relational versus item-specific encoding, separately for healthy comparison subjects (HC) and people with schizophrenia (SZ). Hotter colors reflect greater activation (range z = 2.3 to 6.0). Panel B illustrates significant group differences (HC – SZ) in DLPFC activation during relational versus item-specific encoding in the left (top) and right (bottom) hemisphere. Group differences are indicated in red, with hotter colors reflecting greater activation (range z = 2.3 to 6.0), and are overlaid on DLPFC (in green) and VLPFC (in blue) ROIs to illustrate the regional specificity of prefrontal dysfunction in SZ. Surface renderings performed with Caret (5.61) software (http://brainvis.wustl.edu/wiki/index.php/Caret:About)

