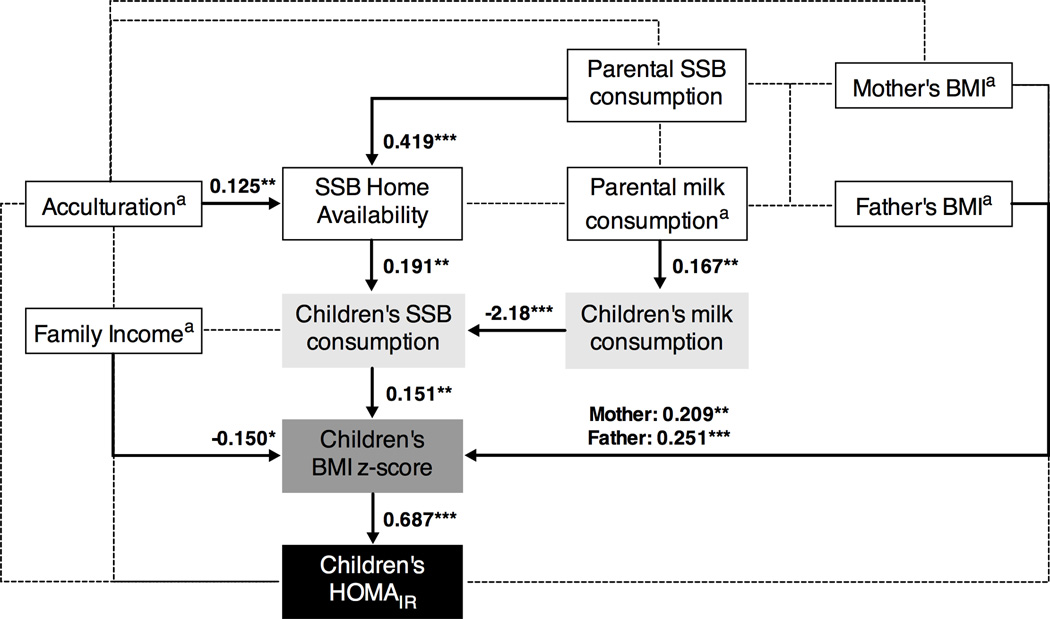
Figure 1. Structural Equation Model with Estimated Parameters for 187 Hispanic Children.
Familial and individual correlates of Hispanic children’s SSB consumption, BMI z-score, and HOMAIR. Statistically significant path coefficients are presented as: standardized regression coefficients (β); dashed lines represent relationships that were included in the final exploratory analysis, but were not significant. Model fit: X2 = 45.821 (d.f. = 30, P > 0.01 and < 0.05), X2/d.f. = 1.53, RMSEA = 0.053 (90% C.I. = 0.016, 0.082), and CFI = 0.904.
aThese variables were log-transformed to improve multivariate normality.
***P value <0.01; **P value <0.05, *P value ≤ 0.05.

