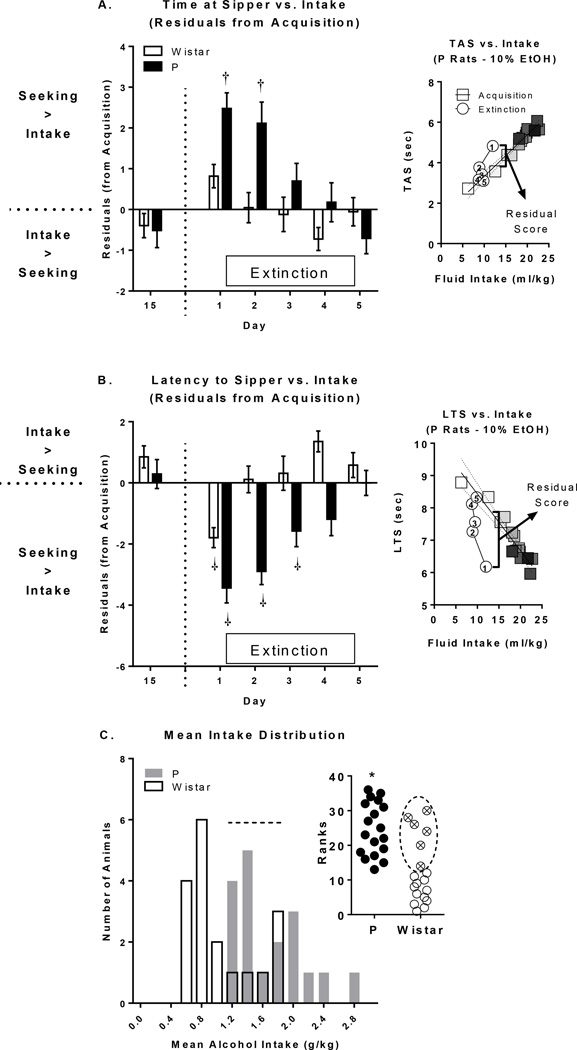
Figure 3.
Alterations in the relationship between fluid intake and time at sipper (TAS) and latency to sipper (LTS). A-B) The relationship between TAS/LTS and fluid consumption that was established during acquisition broke down during extinction in P rats for both TAS/LTS measures and for LTS only in Wistar rats. Furthermore, this effect was larger in magnitude and duration in P rats compared to Wistar rats. Insets to right of Panels A and B serve as representative examples of how residuals scores were determined. Square symbols reflect alcohol days 1–15 and are increasingly shaded from white (Day 1) to black (Day 15). Circles reflect each of the 5 days of extinction and are numbered accordingly. Regression lines and associated confidence intervals for alcohol days are shown. C) The distribution of mean 2CAP alcohol intake was significantly different between P and Wistar rats (inset). However, there were 6 Wistar rats that had mean alcohol intake that fit within the P rat mean alcohol intake distribution; these Wistar animals are highlighted by dotted lines. †’s indicate within-rat population differences from day 15 (p’s <.05). *’s indicate between rat population group differences; p’s<.05).

