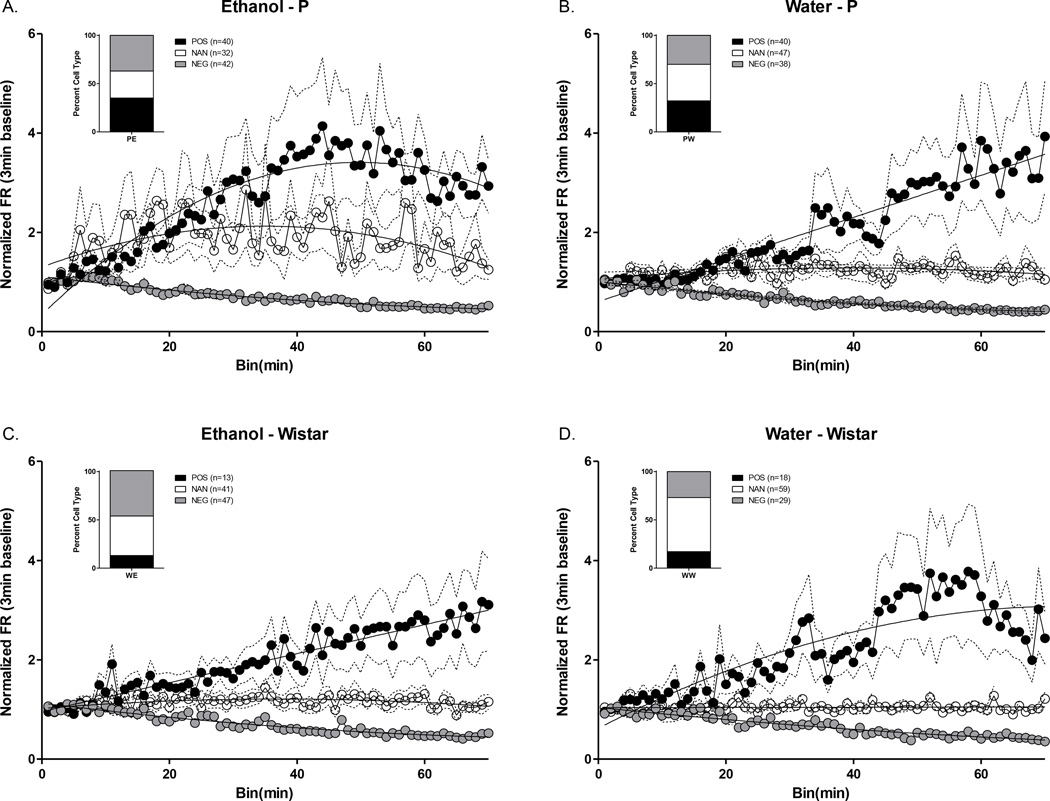
Figure 5.
Classification of the percentage of neurons that changed FR. The proportion of cells that displayed increases, decreases, or no change in FR was significantly different between alcohol P and alcohol Wistar (A. vs C. p<.001), water P and water Wistar (B. vs D. p<.01), and water and alcohol Wistar (C. vs D. p<.05). Dotted lines represent standard error of the mean (±SEM).

