Figure 1.
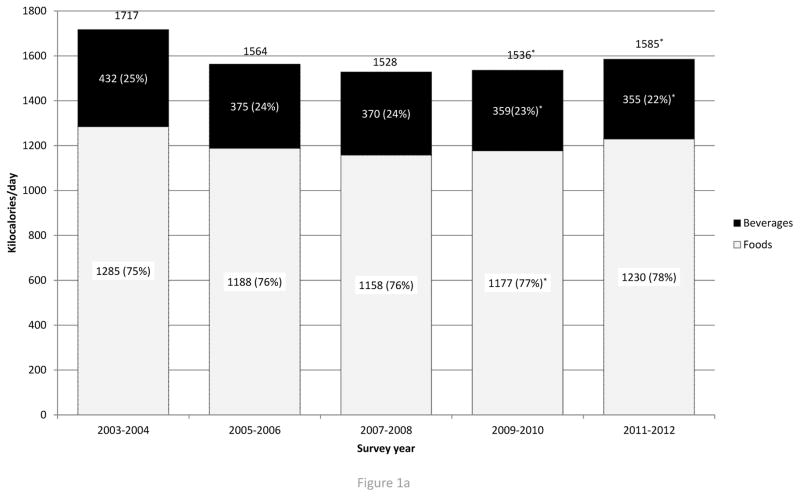
Figure 1a. Trends in total caloric intake from beverages, foods, and total foods and beverages (kcal/d), from 2003 to 2012 among U.S. children ages 2–5y who participated in What We Eat in America’s National Health and Nutrition Examination Survey during survey cycles 2003–04, 2005–06, 2007–08, 2009–10, or 2011–12.
*Value was significantly different from value in 2003–04 was significant, Bonferroni-adjusted p<0.05
†Value in 2011–12 was significantly different from value in 2009–10, Bonferroni-adjusted p<0.05
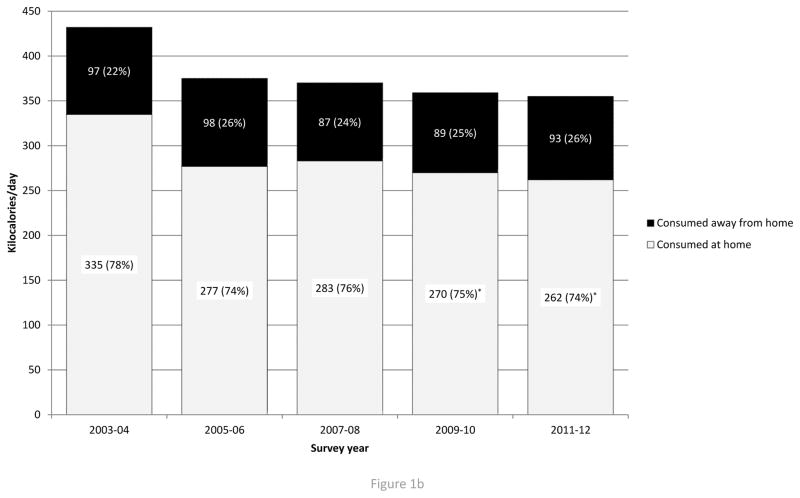
Figure 1b. Trends in total beverage intake (kcal/d) by eating location (home or away) from 2003 to 2012, U.S. children ages 2–5 years among U.S. children ages 2–5 years who participated in What We Eat in America’s National Health and Nutrition Survey during survey cycles 2003–04, 2005–06, 2007–08, 2009–10, 2011–12.
*Value was significantly different from value in 2003–04 was significant, Bonferroni-adjusted p<0.05
†Value in 2011–12 was significantly different from value in 2009–10, Bonferroni-adjusted p<0.05
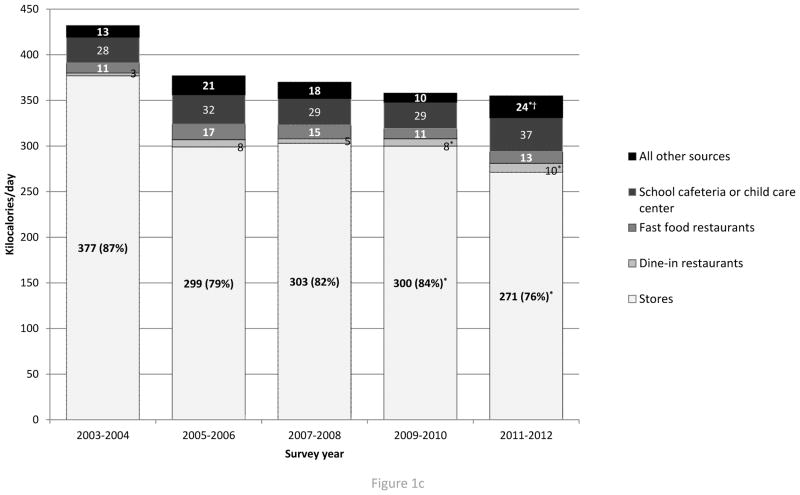
Figure 1c. Trends in total beverage intake by source (kcal/d) from 2003–04 to 2011–2012 among U.S. children ages 2–5y who participated in What We Eat in America’s National Health and Nutrition Examination Survey during survey cycles 2003–04, 2005–06, 2007–08, 2009–10, or 2011–12.
*Value was significantly different from value in 2003–04 was significant, Bonferroni-adjusted p<0.05
†Value in 2011–12 was significantly different from value in 2009–10, Bonferroni-adjusted p<0.05


