
Figure 1.
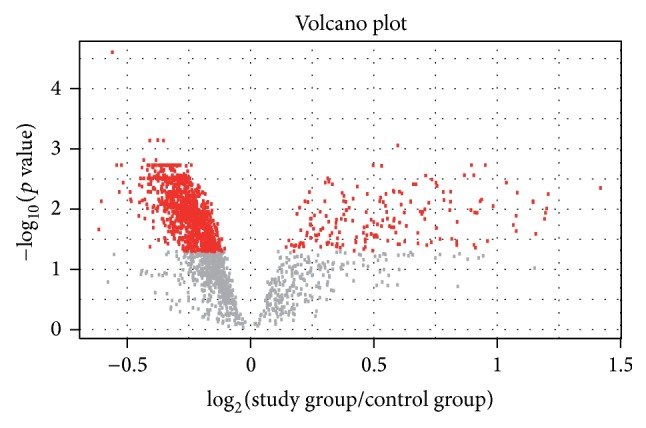
Volcano plot for all analyzed human miRNAs. The x-axis (horizontal) is the fold change between endometriosis and control samples (on a log scale, so that up- and downregulation appear symmetric), and y-axis represents the p value for a test of differences between samples (most conveniently on a negative log scale, so smaller p values appear higher up). Red dots represent miRNAs significantly differentially expressed.