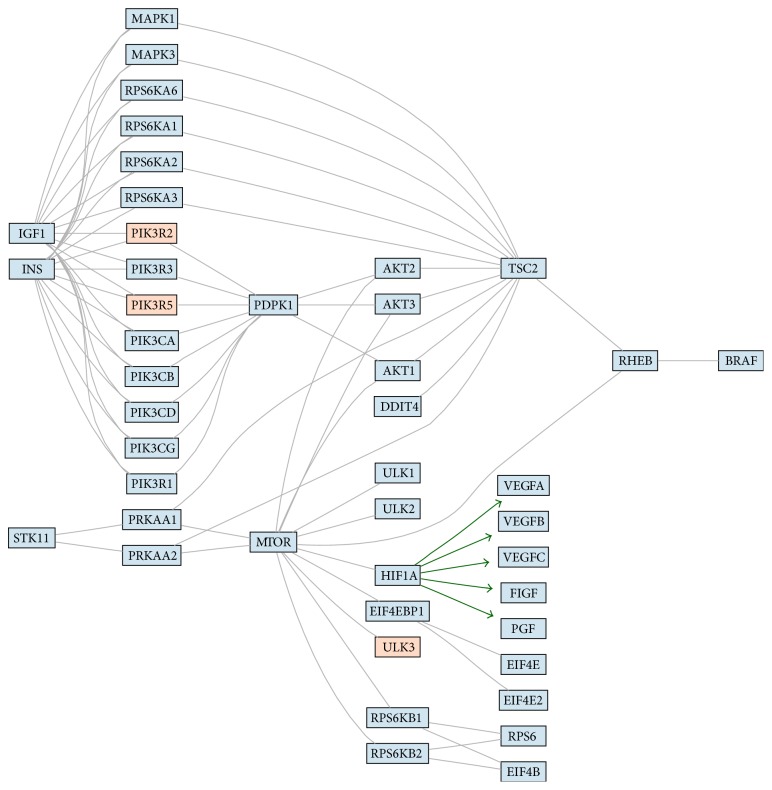
Figure 3.
The figure shows signaling pathways (3: mTOR and 4: VEGF) with marked hypothetical influence of miRNA. The colors present expression of miRNAs assigned to a particular gene. The blue color stands for higher expression in control samples, and the red color stands for higher expression endometriosis. The color scale represents the magnitude of changes. The green arrows represent connections start from transcription factor and which hypothetical expression changes are consistent with hypothetical expression changes of genes regulated by this transcription factor.

