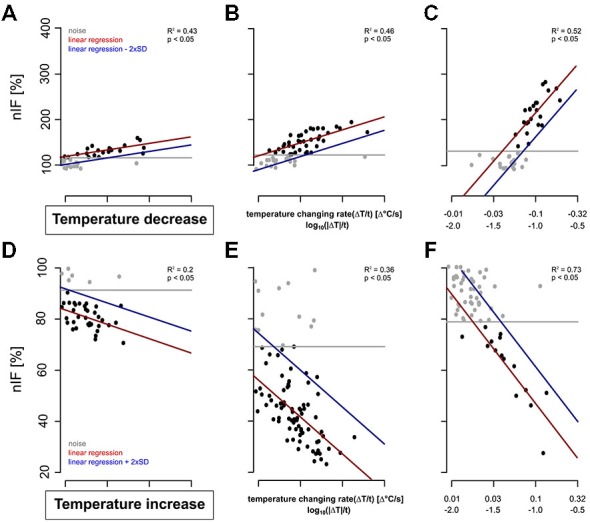
Figure 5.

Examples of dose-response curves (red) of six TT-neurons. The neuronal activities of the cold-sensitive neurons 240 s after stimulus onset are represented in gray and black. The noise level of the resting activity is indicated by the gray line and that of the neuronal response during temperature stimulation in blue. (A–C): Three TT-neurons stimulated with cold air stimulus with (A) low differential sensitivity and low detection threshold, (B) intermediate differential sensitivity and low detection threshold, and (C) high differential sensitivity and high detection threshold. (D–F): Three TT-neurons stimulated with increasing temperature with (D) low differential sensitivity and low detection, (E) intermediate differential sensitivity and low detection threshold, and (F) high differential sensitivity and high detection threshold.
