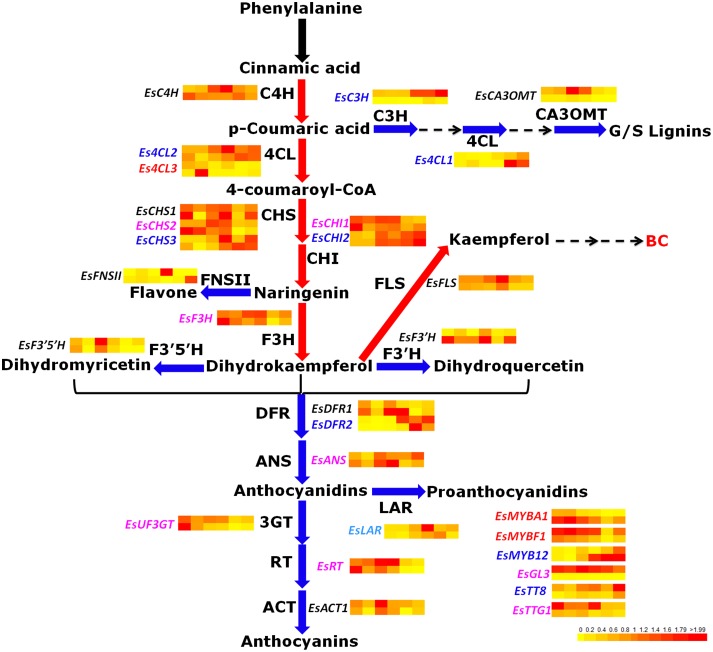
Figure 1.
The predicted flavonoid pathway and the expression patterns of flavonoid-related genes in leaves of E. sagittatum. Enzyme abbreviations: 4CL, 4-coumarate: CoA ligase; ACT, acyl transferase; ANR, anthocyanidin reductase; ANS, anthocyanidin synthase; C3H, p-coumarate 3-hydroxylase; C4H, cinnamate-4-hydroxylase; CA3OMT, caffeic acid 3-O-methyltransferase; CHI, chalcone isomerase; CHS, chalcone synthase; DFR, dihydroflavonol 4-reductase; F3′H, flavonoid 3′-hydroxylase; F3′5′H, flavonoid 3′,5′-hydroxylase; F3H, flavanone 3-hydroxylase; FLS, flavonol synthase; FNS II, flavone synthase II; 3GT, 3-glucosyl transferase; LAR, leucoanthocyanidin reductase; RT, rhamnosyl transferase. The blue and red arrows indicate the catalysis steps by enzymes negatively and positively contributing to bioactive component (BC) accumulation in E. sagittatum, respectively. The black arrow represents that the first step of the phenylpropanoid pathway catalyzed by the PAL enzyme (phenylalanine ammonia-lyase) is not included for analysis in this study. In both the HN3 and JX3 lines, the genes in blue and red are negatively and positively responsible for BC accumulation, respectively. In either the HN3 or JX3 lines, the genes in light blue and purple are negatively or positively involved in BC biosynthesis, respectively. The genes in black indicate no correlation with BC accumulation. For gene expression, the expression levels of flavonoid-related genes are normalized from 0 to 2 as shown in the lower-right-corner bar and displayed by the BAR HeatMapper Plus Tool (http://bar.utoronto.ca/ntools/cgi-bin/ntools_heatmapper_plus.cgi). For the heat map, the upper-row and bottom-row indicate the expression pattern of genes in the HN3 and JX3 lines, respectively. The six dots in each row correspond to an expression profile of gene obtained at six different developmental stages of leaves.

