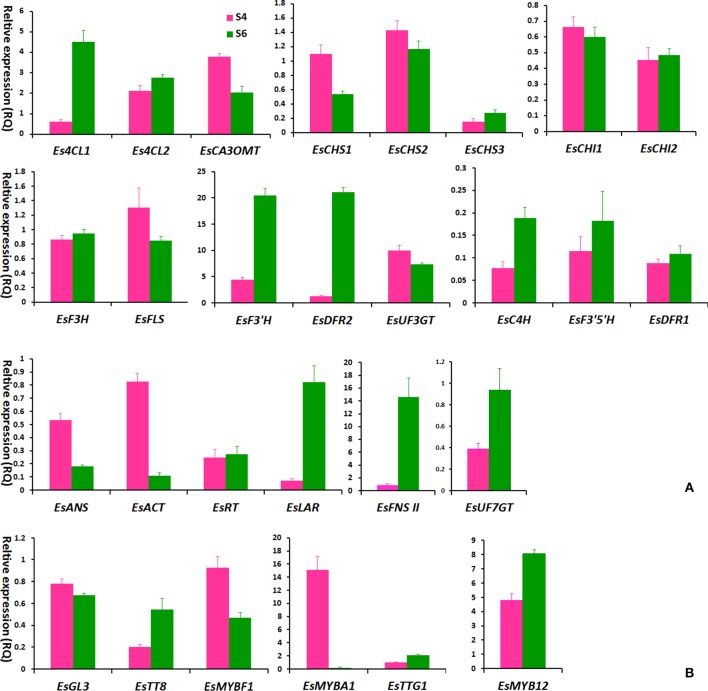
Figure 6.
The expression levels of flavonoid-related genes in S4 and S6-staged leaves of the HN2-43 line of E. sagittatum by qPCR assay. Most structural genes (A) and several putative regulatory genes (B) of the flavonoid pathway are selected for qPCR assay, and each column indicates the mean value plus SD (standard deviation) from triple technical replicates. The S4 and S6-staged leaves of HN2-43 are shown in Figure 5.

