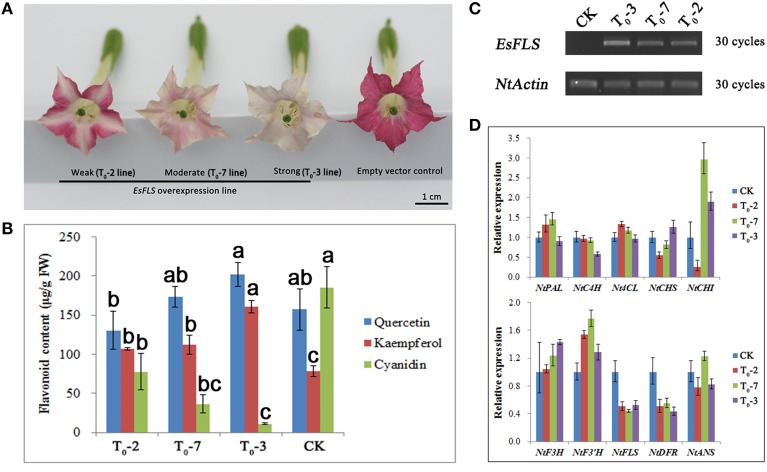
Figure 7.
Overexpression characterization of EsFLS in transgenic tobacco. (A) Phenotypic observation of transgenic tobacco overexpressing the EsFLS gene and the empty vector pMV as a negative control. (B) Measurement of flavonoid content in transgenic tobacco overexpressing EsFLS with an empty vector as a negative control (CK). Flavonoid content was determined as aglycones (kaempferol, quercetin, and cyanidin) using HPLC analysis. Each column represents the mean value plus SD (standard deviation) from three biological replicates. Columns labeled by the same letter are not statistically significant according to Duncan's multiple range test (P ≤ 0.05). (C) Detection of EsFLS expression in transgenic tobacco by RT-PCR. (D) QPCR analysis of the expression levels of flavonoid genes in transgenic tobacco overexpressing EsFLS and an empty vector as a negative control (CK). Each column represents the mean value plus SD (standard deviation) from three technical replicates.

