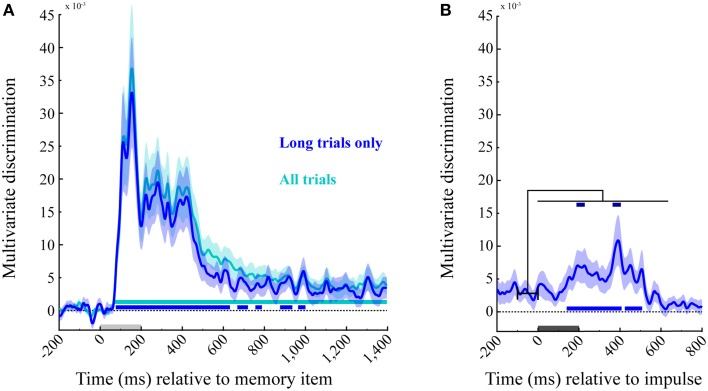
Figure 5.
Multivariate discrimination of the memory item across time. (A) Memory item epoch. The discrimination for both trial types (in cyan), and exclusively for the long trials used in the impulse response analysis (in blue). Significant positive clusters are marked with bars in the corresponding colors. (B) Impulse epoch. The discrimination of memory item is shown for long trials (in blue), with positive clusters are marked in the corresponding significance bar along the bottom. Significant increases in discrimination compared to the mean discrimination 100 ms prior to impulse onset are indicated with dark-blue bars at the top. Light-gray and dark-gray bars represent memory item and impulse presentation, respectively. Error bars are standard deviations from the permuted null-distributions.

