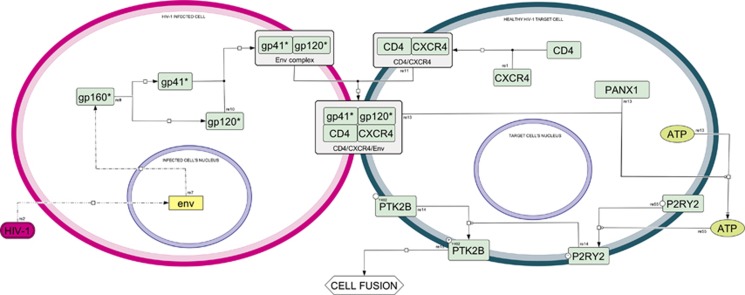
Figure 1.
Syncytial apoptosis map—cell fusion. Interaction between a HIV-1-infected cell (purple compartment) and a CD4+ healthy cell (green compartment). This part includes all the reactions leading to the activation of P2RY2 and PTK2B proteins, determining cell-to-cell fusion. Nuclei are denoted with blue contours, proteins are colored in green, genes are colored in yellow, viruses are colored in purple. Asterisks indicate non-official HGNC names. Please see Supplementary Information for more detailed map notion

