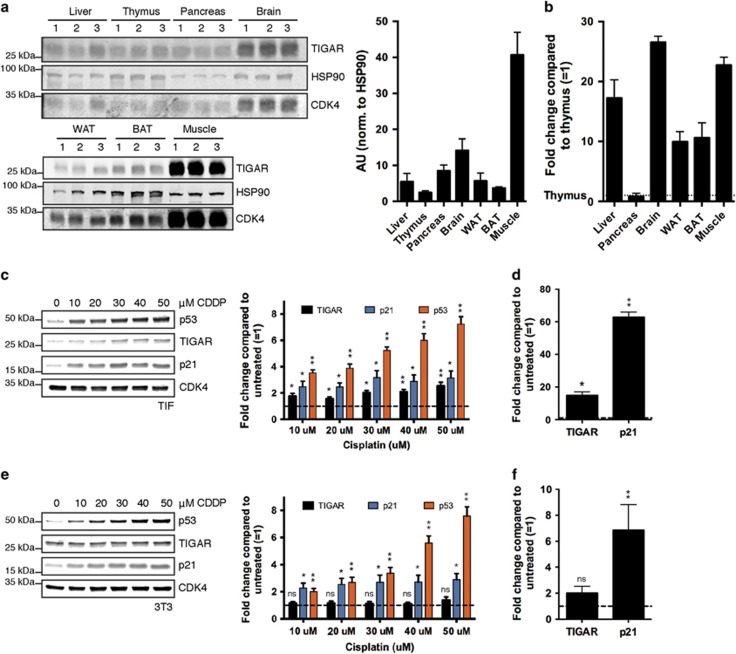
Figure 1.
Basal TIGAR expression and its response to p53 activation. (a) Left: Western blot analysis of indicated tissues from three different wild-type (WT) animals. Right: Graph represents quantification of western blots. (b) mRNA expression of TIGAR in indicated tissues of WT animals. (c) Left: Western blot analysis of Tert-Immortalised Fibroblasts (TIFs) treated with indicated concentrations of cisplatin (CDDP) for 24 h. Right: Graph represents quantification of western blots with fold change compared with untreated. (d) mRNA expression of TIGAR and p21 following 24 h of CDDP treatment (50 μM) in TIFs. (e) Left: Western blot analysis of 3T3s treated with indicated concentrations of CDDP for 24 h. Right: Graph represents quantification of western blots with fold change compared with untreated. (f) mRNA expression of TIGAR and p21 following 24 h of CDDP treatment (50 μM) in 3T3s. Right: Graph represents quantification of western blots with fold change compared with untreated. Values represent mean±S.E.M. of three independent experiments unless otherwise indicated. *P<0.05, **P<0.005 compared with untreated unless otherwise indicated. NS, not significant

