Figure 3.
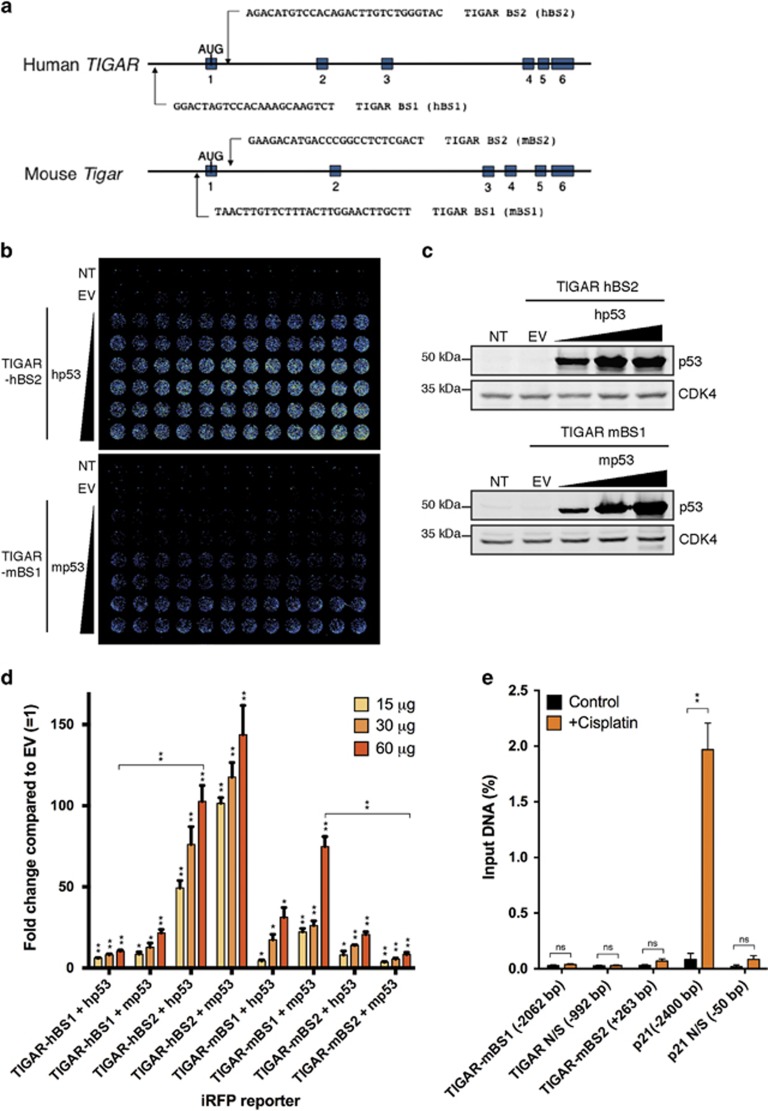
Comparison of human and mouse p53-binding sites on the TIGAR promoter. (a) Possible p53-binding sites along human and mouse TIGAR. (b) Representative iRFP reporter assay scan of HCT116 p53−/− cells 24 h after co-transfection with TIGAR-hBS2 or TIGAR-mBS1 iRFP reporter and increasing amounts of human p53 or mouse p53. (c) Western blot analysis of HCT116 p53−/− cells transfected with increasing amounts of human p53 or mouse p53. (d) Quantification of iRFP reporter scans on human (hBS1 and hBS2) and mouse (mBS1 and mBS2) TIGAR promoter-binding sites with increasing levels of human or mouse p53. (e) Chromatin-immunoprecipitation (ChIP) was performed for p53 with quantitative PCR for mBS1 (−2062 bp), mBS2 (+263 bp), a p53 response element on the p21 promoter (−2400 bp) and non-specific (N/S) binding regions on the Tigar (−992 bp) and p21 promoter (−50 bp), using 3T3s treated with 50 μM cisplatin for 24 h. Values represent mean±S.E.M. of three independent experiments. *P<0.05, **P<0.005 compared with empty vector (EV) or control. NT, non-transfected; NS, not significant

