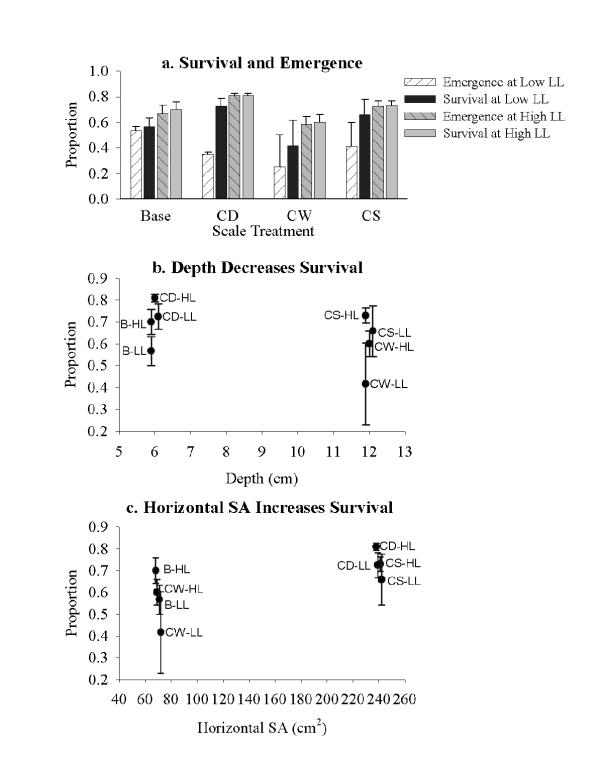
Figure 2.
Survival effects. a. Average survival (+/- 1 s.e.) for all eight treatment combinations. White and grey, hatched bars (first and third in each set) are emergence at low and high leaf litter, respectively, and dark and light blue bars (second and fourth in each set) are survival at low and high leaf litter, respectively. b. Mean proportion survival for four treatments at each of two depths. c. Mean proportion survival for four treatments at each of two horizontal surface areas. For b and c, points are offset slightly on the x-axis to better view error bars (which = 1 s.e.). HL = high leaf litter treatments, and LL = low leaf litter treatments, and codes for scale are as in text.

