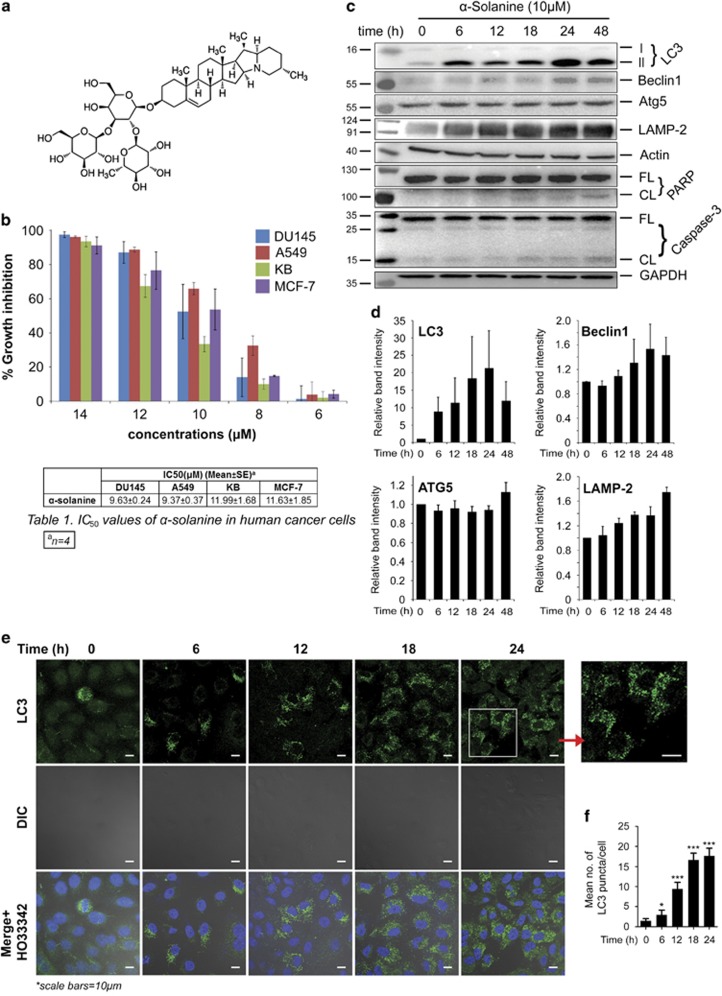
Figure 1.
α-Solanine-induced autophagy in A549 cells. (a) Chemical structure of α-solanine. (b) Cytotoxic effect of α-solanine. Cells were treated with α-solanine for 48 h at indicated concentration and cell viability was measured by SRB assay. (c) A549 cells were treated with 10 μM α-solanine for indicated time points. Cell lysates were analyzed by immunoblotting for autophagic and apoptotic markers. (CL, cleaved; FL, full length). (d) Bar graphs representing densitometric quantification of the western blot data (mean±S.E.) of three independent experiments. (e) A549 cells were treated with 10 μM α-solanine and were fixed at different time points. Cells were then reacted with anti-LC3 antibody and were analyzed by confocal microscopy after incubation with Alexafluor 488 tagged anti-rabbit IgG. (f) Bar graph representing average number of typical LC3 puncta/cell. Data are means±S.E. from minimum 25 cells for each experiment; *P=0.2482, ***P<0.0001, compared with untreated control

