Figure 6.
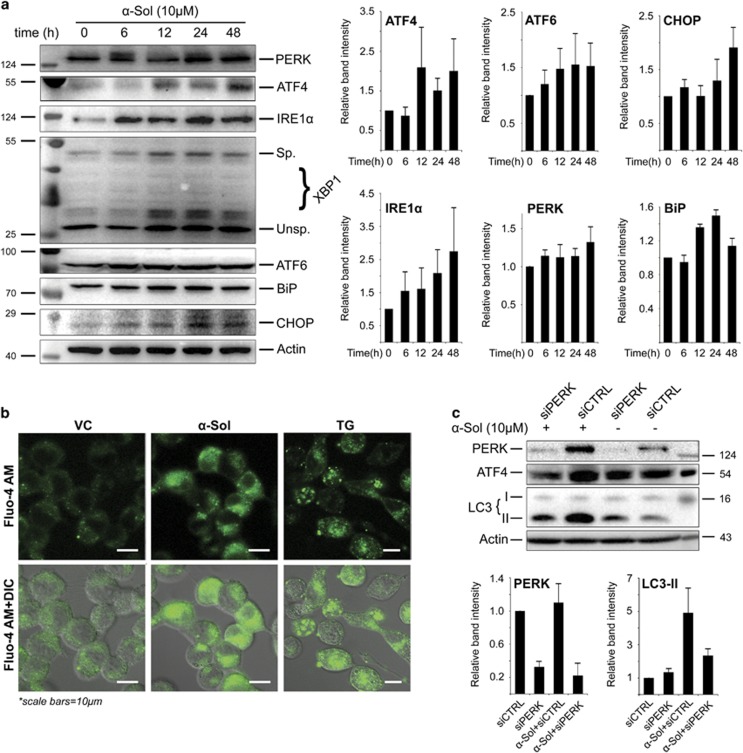
α-Solanine activated UPR pathway. (a) A549 cells were exposed to 10 μM α-solanine and harvested at indicated time points. Cell lysates were subjected to western blot assay to determine activation of UPR pathway and band intensities were quantified. (b) ER calcium ion release in α-solanine (10 μM, 24 h) treated cells was investigated by fluorescence microscopy after staining with 5 μM Fluo-4AM. (c) A549 cells were transfected with non-targeting or PERK siRNA and treated with α-solanine for 24 h. The corresponding proteins were evaluated by immunoblotting and band intensities were quantified

