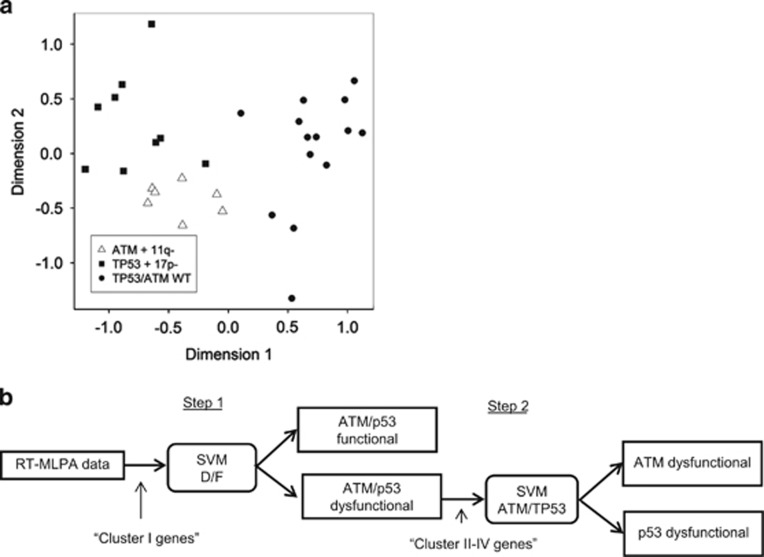
Figure 1.
Design of statistical classifier based on the 10-gene panel. (a) Projection of the pairwise relationships among the samples included in the training cohort based on the FI of mRNA expression levels following irradiation and generated using multidimensional scaling analysis (MSA). Each patient is represented by a symbol, with the spatial proximity between any two symbols indicating the degree of similarity between the FI profiles of 10 selected genes (FAS, Bax, BBC3, CDKN1A, FDXR, PCNA, NME1, MYC, PYCR1, ACSM3) for the two corresponding patients. (b) Schematic overview of the two-stage construction of the support vector machine (SVM) classifiers, which allows classification of CLL samples into three different types of response, that is, ATM/p53-functional, p53-dysfunctional or ATM-dysfunctional based on the FIs of the cluster I-IV genes

