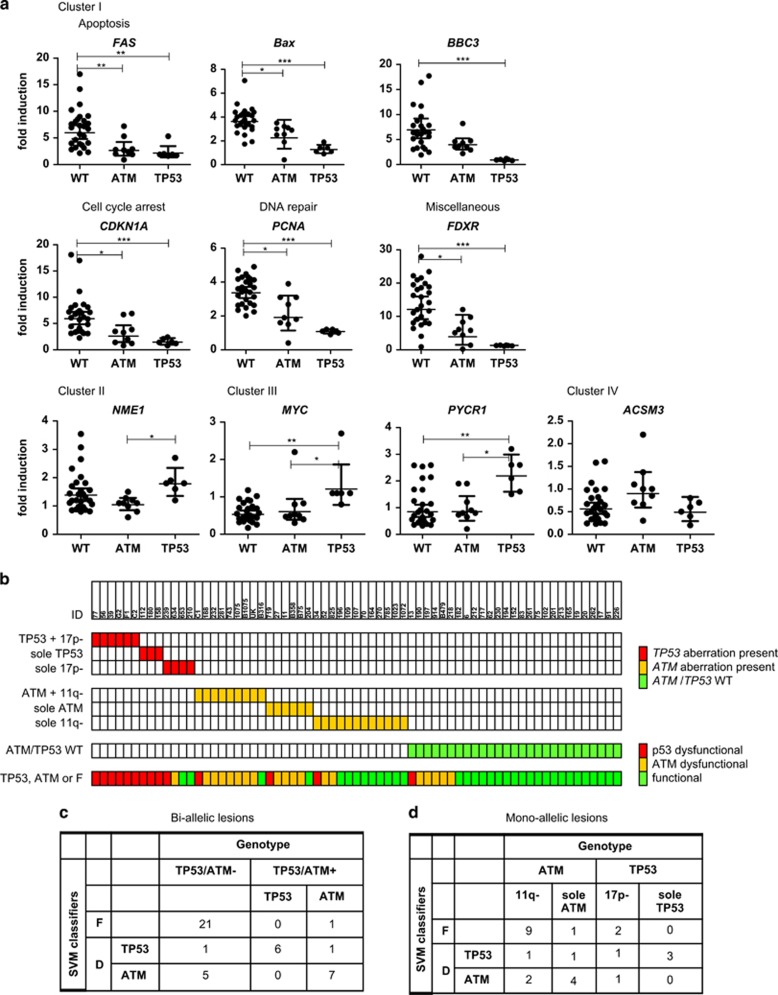
Figure 2.
Validation of RT-MLPA assay and SVM classifiers in an independent validation cohort. (a) CLL cells of samples included in the validation set with clear genotypic characteristics, that is, TP53/ATM WT (n=27), biallelic TP53 defects (n=6) or biallelic ATM defects (n=9) (i.e., mutation+deletion) were treated with or without irradiation (5 Gy) followed by measurement of mRNA expression levels using RT-MLPA. FI was calculated as the gene expression following irradiation divided by the gene expression level in the corresponding non-irradiated sample. Symbols represent individual patients. Geometric mean±95%CI within each group is shown. Significant differences in FI are presented as *0.01≤P<0.05; **0.001≤P<0.01; ***P<0.001 (Kruskal-Wallis test with Dunn's multiple comparison post hoc analysis). (b) Shown are the results of the SVM classifiers on the validation cohort (in lower line). Rows represent TP53 and ATM aberrations, columns represent individual patients. In the upper three rows, color coding is based on: TP53 aberrations (white, absence of TP53 aberration; red, presence of TP53 aberration). In the following three rows, color coding is based on: ATM aberrations (white, absence of ATM aberration; orange, presence of ATM aberration). In the following row, color coding is based on: absence of TP53/ATM aberrations (white, presence of TP53 and/or ATM aberration; green, TP53/ATM WT). In the bottom row, color coding is based on results of SVM classifiers (red, p53-dysfunctional; orange, ATM-dysfunctional; green, p53/ATM-functional). (c, d) Contingency table for the classification of (c) bi-allelic lesions and (d) mono-allelic lesions

