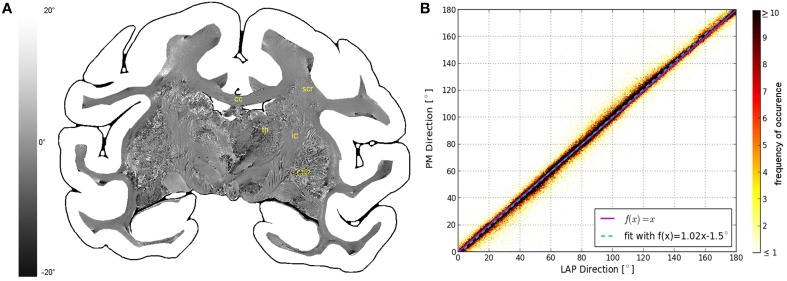
Figure 3.
Consistency of the measured fiber direction angle. (A) Displays a differential map of the fiber direction maps obtained with the PM and LAP. It highlights in which areas the largest differences of the measured fiber directions occur. (B) Shows a scatterplot displaying a direct comparison of the measured fiber direction angles. The color code indicates the number of occurrences.

