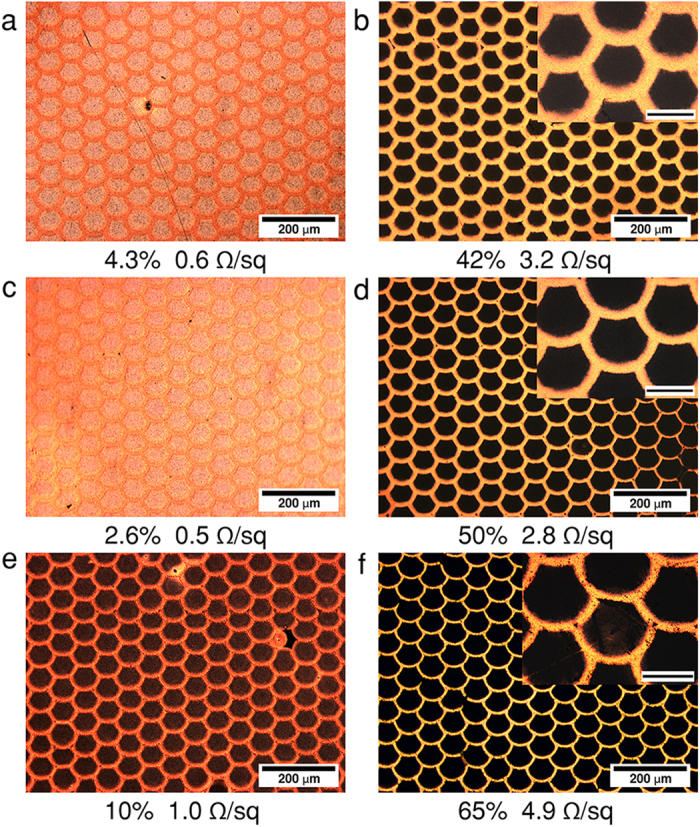
Figure 2. Control sample (a,c,e) and samples etched by using Na2S2O8 (5 g/L) for 20 s (b), 40 s (d), and 60 s (f).

The scale bars in the insets are 50 μm. (Corresponding UV-VIS spectra are shown on Fig. SI-8.).

The scale bars in the insets are 50 μm. (Corresponding UV-VIS spectra are shown on Fig. SI-8.).