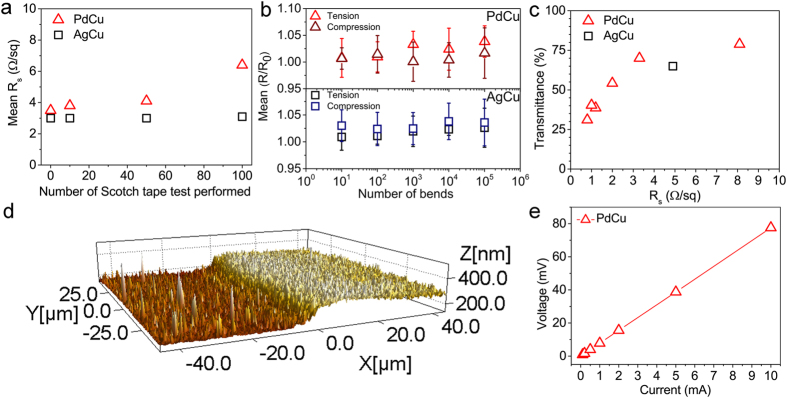
Figure 3. Sheet resistance in the function of number of Scotch tape test performed on the transparent metal electrodes (a), mean Rs/R0 values after bending test for AgCu and PdCu patterns (b), optical transmittance as a the function of sheet resistance for PdCu grid patterns having various grid size and for AgCu pattern (c).

AFM image (d) and I-V curve (e) for a PdCu straight line.
