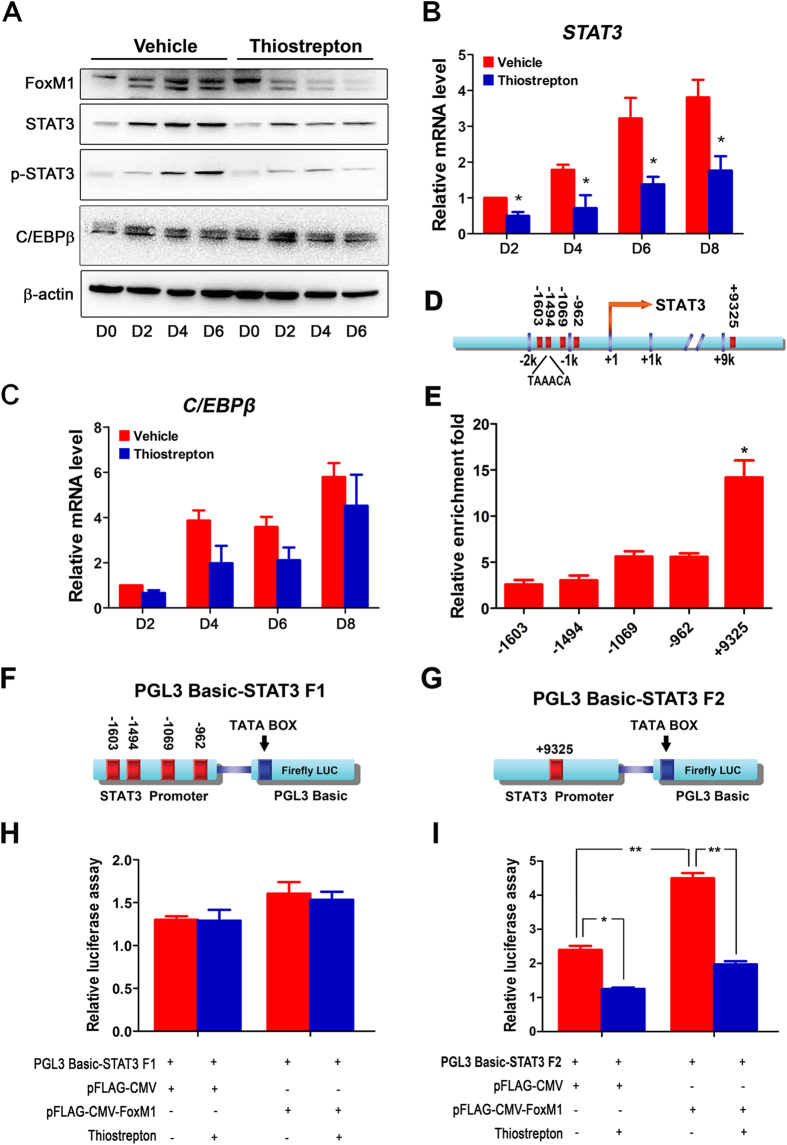
Figure 5. FoxM1 directly targets STAT3 in HESCs during E2, MPA and dbcAMP-induced differentiation.
(A) Western blot analysis of FoxM1, STAT3, p-STAT3 and C/EBPβ in differential HESCs treated with vehicle or 1 μm thiostrepton at days 0, 2, 4, 6, respectively. (B,C) Relative mRNA expression of STAT3 (B) and C/EBPβ (C) in HESCs treated with vehicle or 1 μM thiostrepton at days 2, 4, 6 and 8. The values are normalized to the GAPDH expression level and indicated as the mean ± SEM. n = 3. *P < 0.05. (D) Schematic representation of STAT3 promoter region with potential FoxM1 binding sites indicated by red bands. (E) The relative enrichment fold of different FoxM1 binding sites compared with IgG was expressed by ChIP-qPCR. The values represent the mean ± SEM of six replicates from three independent experiments. *P < 0.05. (F,G) Schematic diagram of the PGL3-STAT3 F1 (F) and PGL3-STAT3 F2 (G) reporter constructs for the promoter assay. (H,I) Luciferase assays of Cis-activation potential of the region containing PGL3-STAT3 F1 (F) and PGL3-STAT3 F2 (G) in the presence of the control plasmid, FoxM1 over-expression plasmid or 1 μM thiostrepton. The values are shown as the mean ± SEM. n = 3. *P < 0.05, **P < 0.01.

