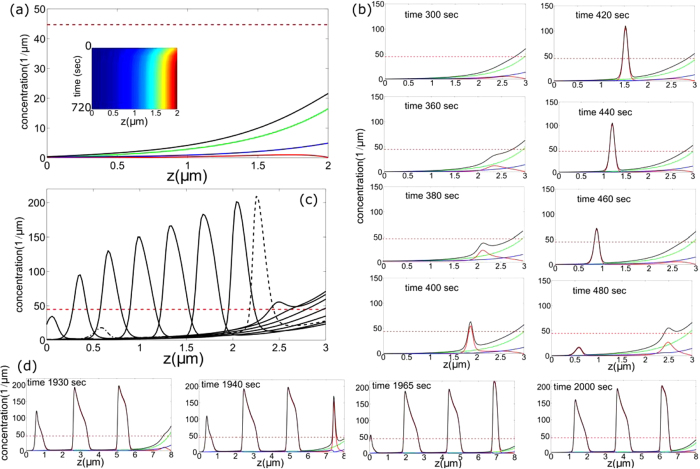
Figure 5.
(a) Steady-state concentration profiles for domains under a critical length (h<hc) and β = 0. The inset shows a corresponding space-time plot of the total myosin concentration. The concentrations of the stalled, processive and free motors (mb, mw, mf) are denoted by the red, blue and green lines respectively, and the sum total concentration in black. The horizontal dashed red line denotes the concentration of stalled myosins in the MU state. Parameters used are: vw = 0.6 μm/sec, vb = 0.016 μm/sec, D = 0.1 μm2/sec, Db = 0.0001 μm2/sec,  sec−1,
  sec−1,
  sec−1,
  sec−1,
  sec−1,
  sec−1, kbw = 2 μm2 and
  μm−1. (b) Snapshots of dynamics on large domains h > hc in which pulses form, and propagate towards the protrusion base. The pulses are generated periodically. (c) Overlayed time course (at 30 sec intervals) of a single pulse (solid line) that forms and decays as it propagates (dashed-dot and dashed pulses are from the previous and next cycles respectively). (d) Pulse train in a longer protrusion.

