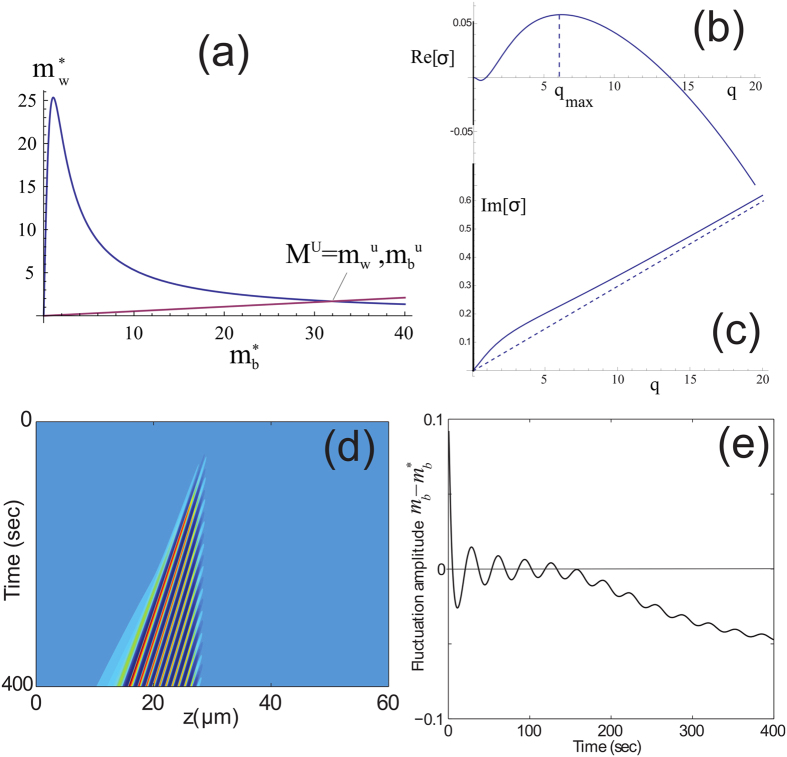
Figure 7.
(a) Continuum of uniform steady-state solutions, for  (Eqs.(1), blue line). The purple line indicates the zero-flux condition which determines MU. (b,c) Real and imaginary parts (respectively) of the dispersion relation about MU. The most unstable mode qmax is denoted in (b), while the advection velocity vb is denoted by the dashed line in (c). (d) Space-time plot of the fluctuation amplitude
  after an initial perturbation located at z = 30 μm, where
  corresponds to the MU state. (e) Exponential decay of the fluctuation in time at the initiation site (in addition to a shift of the overall background due to the spreading of the initial perturbation). Parameters used are: vw = 0.6 μm/sec, vb = 0.03 μm/sec, D = 0.1 μm2/sec, Db = 0.0005 μm2/sec,
  sec−1,
  sec−1,
  sec−1,
  sec−1,
  sec−1,
  sec−1, and kbw = 2 μm2.

