Figure 9.
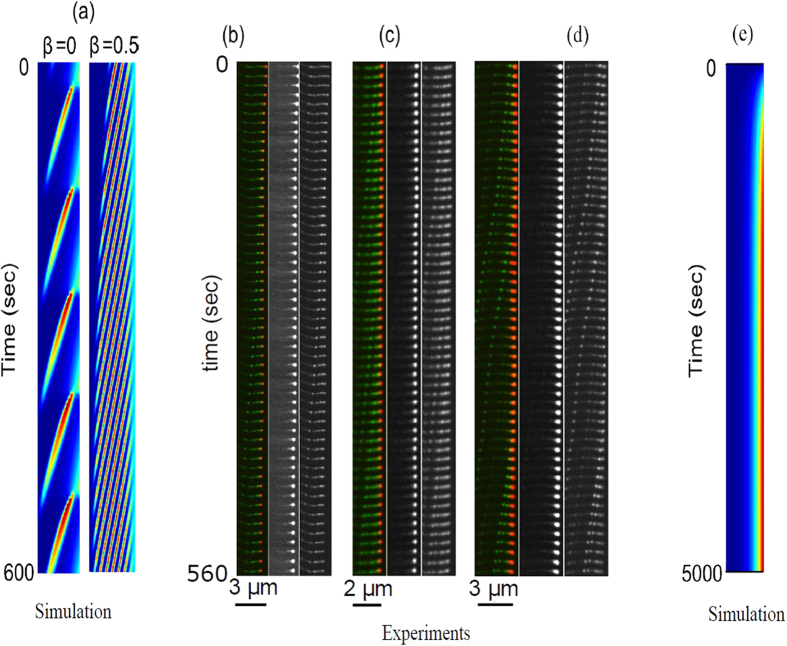
(a) Space-time plots of the model simulations for total concentration, with parameters as in Fig. 5, for different values of β (h = 3 μm). (b–d) Kymographs showing motors in filopodia in experiments on COS7 cells, with the green label for myosin-XV and the red label for myosin-III (left panels). Middle/right panels show myosin-III/XV, respectively. Filopodia lengths in the experiments are around 2–3 μm. In some cases we observe high frequency of pulses (b,c), corresponding to larger values of β (see in (a)), while in others we find a lower frequency (d), which corresponds to a lower value of β → 0. (e) Space-time plot for the total concentration of slow motors, such as myosin-III (vw = 0.075 μm/sec), demonstrating formation of a stable concentration accumulation at the tip.

