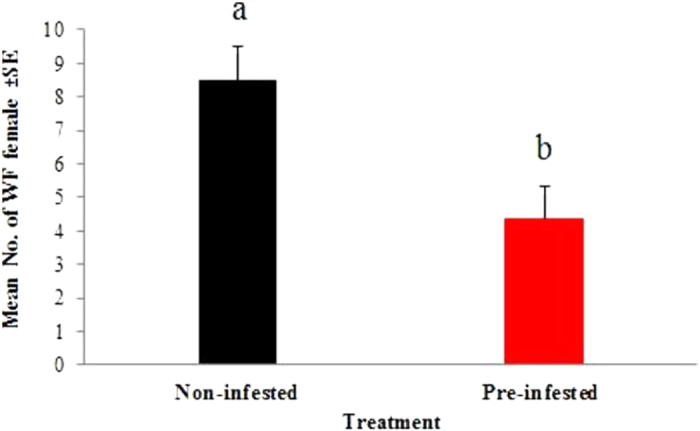
Figure 2. Total mean (±SE) number of settled B. tabaci females in free-choice bioassay with non-infested and pre-infested chilli plants.

Different letters indicate a significant difference at (P < 0. 05). Each bar represents the mean of 5 replicates each assessed at 4 time intervals, using two-way ANOVA.
