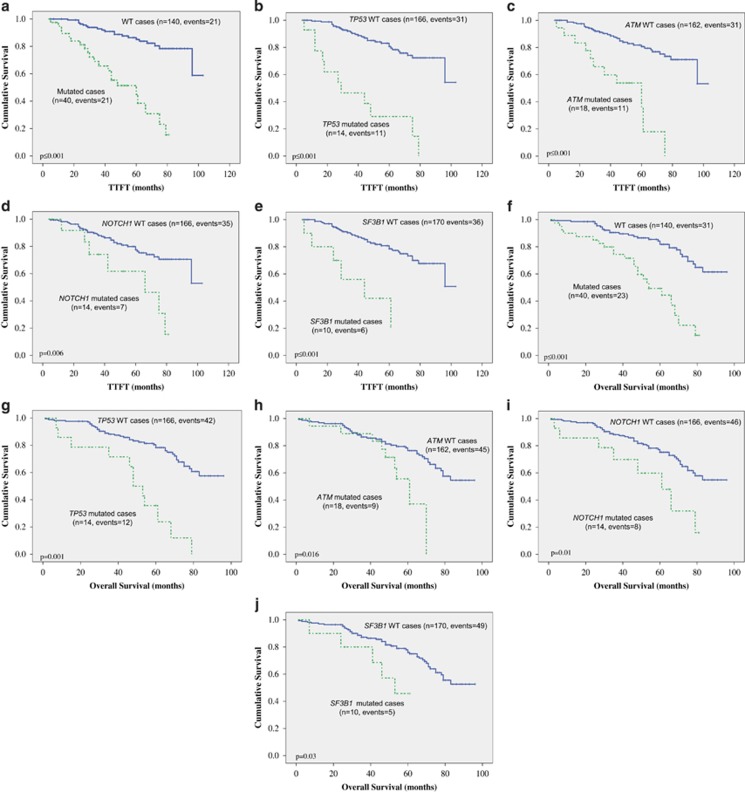
Figure 4.
Differences in time to first treatment (TTFT) and survival outcomes (OS) in patients with, at least a mutation vs non-mutated (a, f); TP53 mutated or WT (b, g); ATM mutated or WT (c, h); NOTCH1 mutated or WT (d, i); and SF3B1 mutated or WT (e, j). P-values presented correspond to the Cox regression between the groups indicated.

