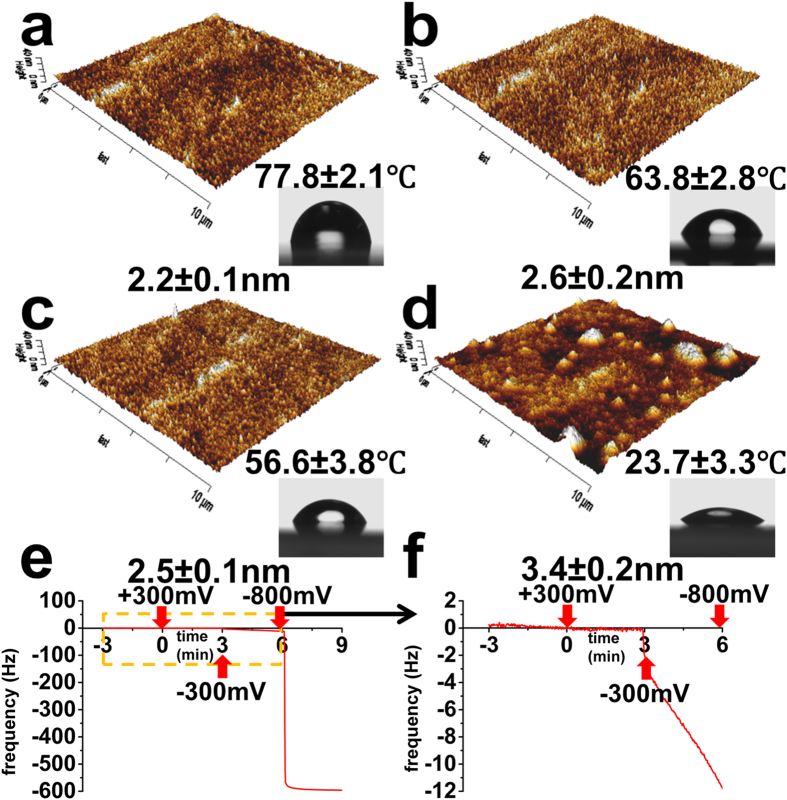
Figure 2. Three-dimensional AFM height images of the native PPy/DBSA polymer.
(a) and same film subjected to a series of applied voltages in the order of (b) +300 mV, (c) −300 mV and (d) −800 mV. Inset shows side-view optical images of milli-q water droplets on film under different surface potentials during goniometry measurements. Contact angle of the PPy/DBSA film at the different applied voltages are displayed above inset images. Values under images are surface roughness. (e) Frequency response from PPy/DBSA as a function of the series of applied voltages in accord with SCFS experiments. (f) Zoomed in region of dashed box in (e). Errors are standard error of the mean (s.e.m), n = 3 (n is number of measured polymer samples).

