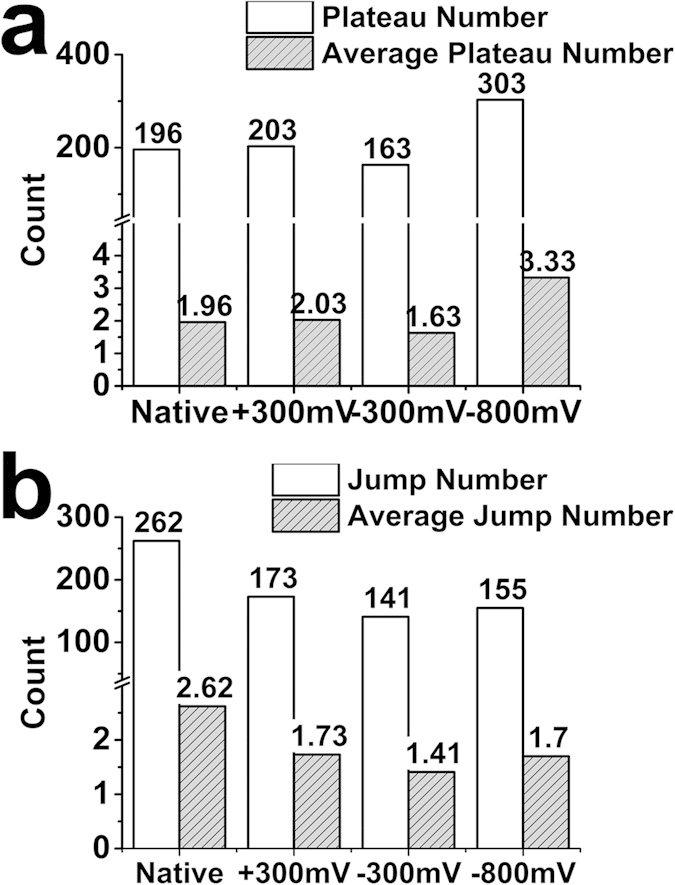
Figure 5. Statistical analysis of jump and plateau events.

(a) Total number of observed plateau interactions obtained for each polymer surface (white bar). Total number is given above each bar. Average number of plateau interactions in each force curve performed on the different polymer surfaces (grey striped bar). The average number is given above each bar. (b) Same anaylsis for jump interactions. A higher number and average of plateau interactions occurs at −800 mV, while a higher number/average for jump interactions occurs on the native polymer.
