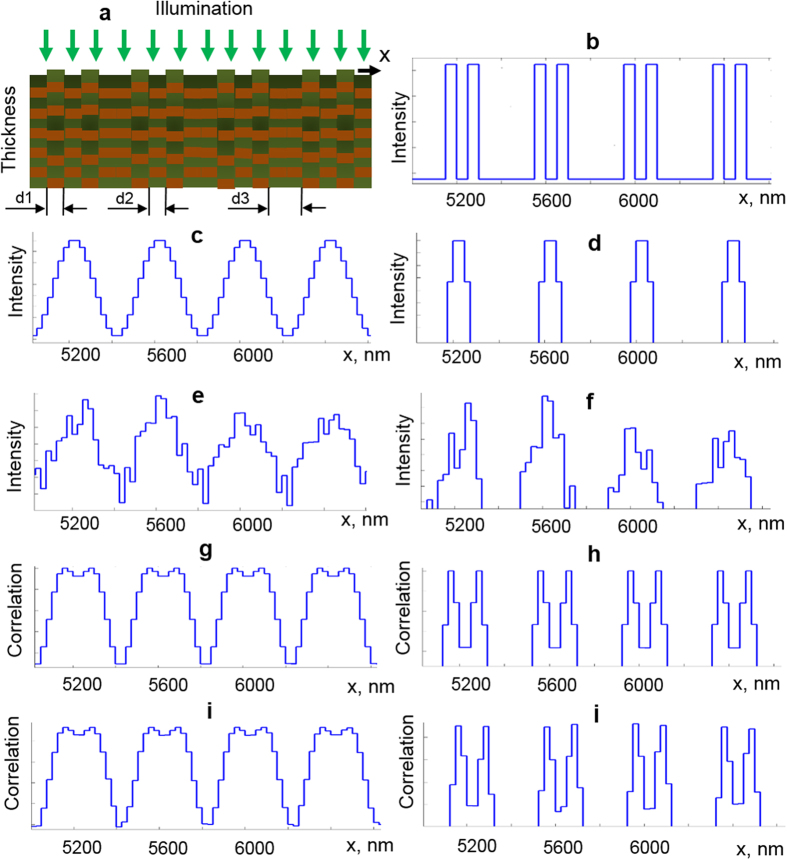
Figure 1. Results of numerical simulation.
(a) Simulated object, d1 = 50 nm, d2 = 50 nm, d3 = 250 nm. (b) Lateral intensity distribution of the reflected light from the object before convolution. (c–f), Intensity distributions in image plane using conventional microscopy. (g–j) Correlation coefficient distributions in image plane using srSESF approach. (c,d,g,h)– without noise; (e,f,i,j)—with noise. (d,f,h,j) are magnified portions of (c,e,g,i).

