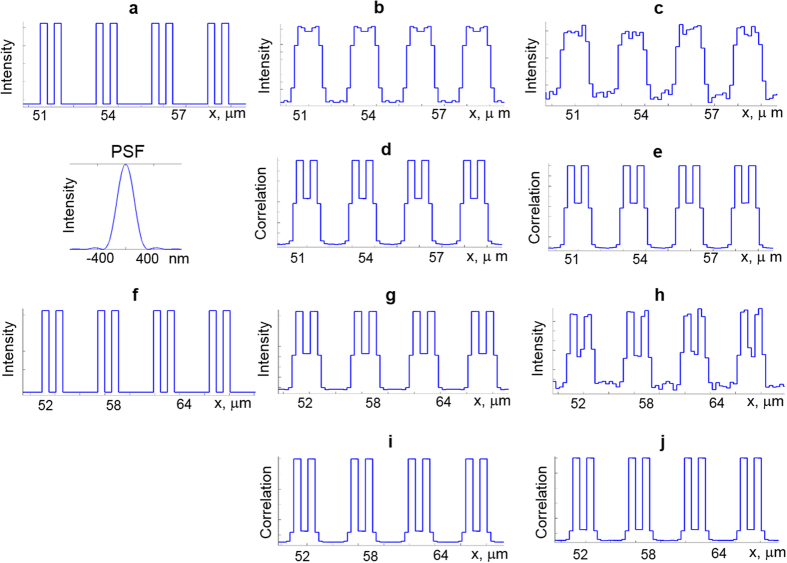
Figure 2. Results of numerical simulation.
(a–e) for d1 = 0.31 μm, d2 = 0.31 μm, d2 = 1.55 μm and (f–j) for d1 = 0.56 μm, d2 = 0.56 μm, d2 = 2.8 μm. (a,f)–Lateral intensity distributions of the reflected light from the object. (b,c,g,h) Intensity distributions in the image plane using conventional microscopy. (d,e,i,j) Correlation coefficient distributions in the image plane using srSESF approach. (b,d,g,i)– without noise; (c,e,h,j)—with noise. PSF—point spread function for objective lens with NA = 0.9, wavelength 600 nm.

