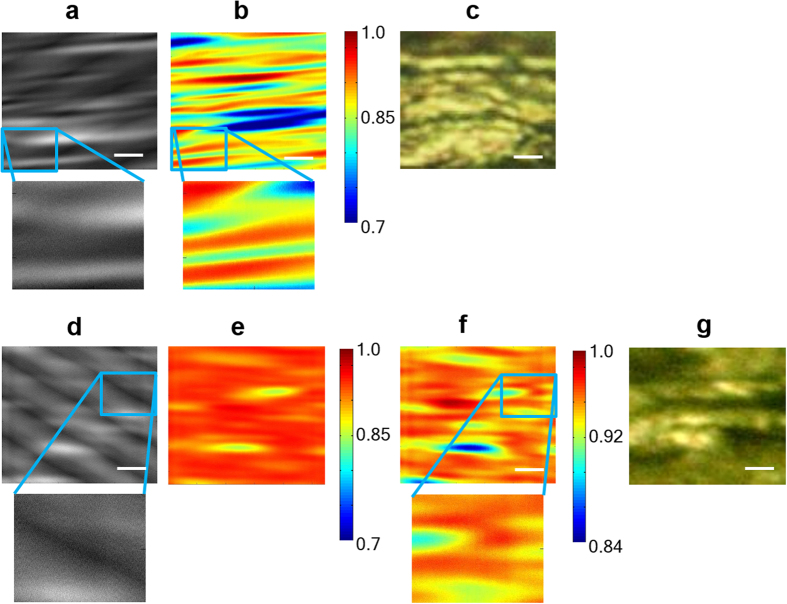
Figure 4. Images of collagen fibres:
(a) and (d), scanning microscopy images with interference fringe noise; (b), (e) and (f), srSESF microscopy images formed using the wavelength range 1230 nm – 1370 nm, NA = 0.5, reveal the horizontal fibers; (c) and (g) high resolution conventional bright field images using visible light, NA = 0.8. The scale bar is 2 microns.

