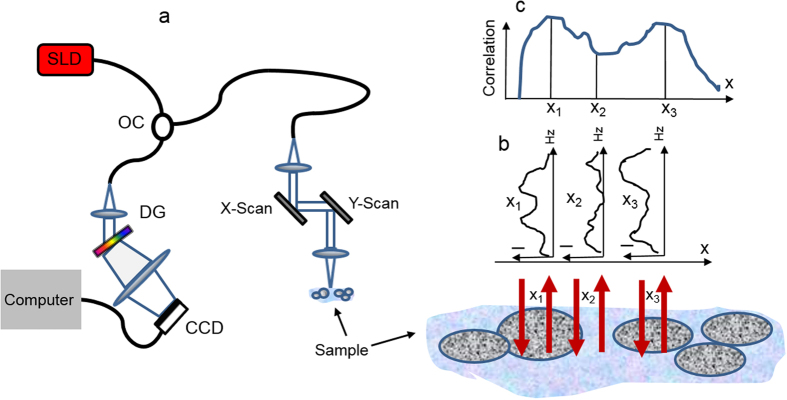
Figure 5. Schematic of the scanning microscope experimental setup with image acquisition.

(a) – microscope, where SLD—superluminescent diode 1230 nm–1370 nm, OC—optical coupler, DG—diffraction grating. (b) – axial spatial period profiles for different lateral locations, (c) – srSESF image.
