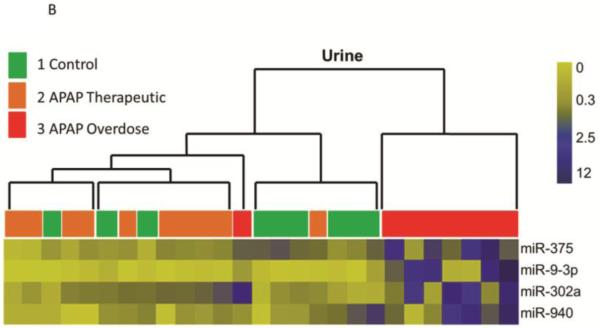
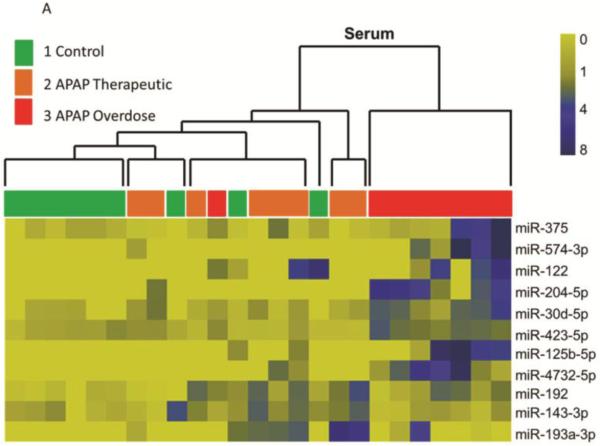
Figure 1. Clustering analysis of study subjects based on the pattern of altered miRNAs, the APAP overdose group is separated with others.

A. Heat map analysis showing normalized counts and a distinct serum miRNA pattern of the APAP overdose group. Group 1 (n=9) are indicated in green, Group 2 (n=8) are in orange and samples from Group 3 (n=8) are in red. B. Heat map analysis showing normalized miRNA levels and a distinct urinary miRNA pattern of the APAP overdose group. Group 1(n=9) are indicated in green, Group 2 (n=10) are in orange and samples from Group 3 (n=8) are in red.

