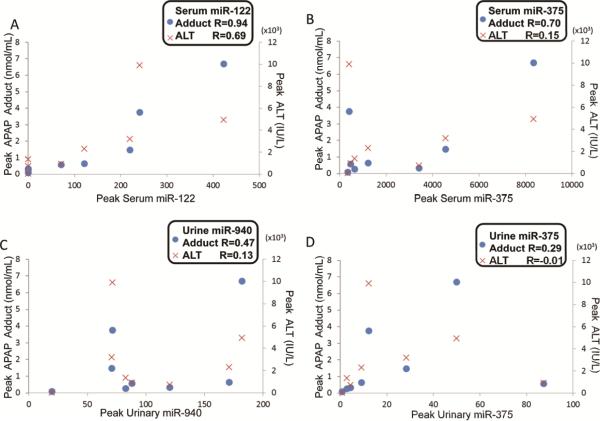
Figure 2. Correlation of peak miRNA to APAP protein adducts or ALT, with p ≤ 0.05 was considered as statistically significant.
Correlation between miRNAs (x-axis) and APAP protein adducts (dot, left y-axis) or ALT levels (x-symbol, right y-axis) were determined by the Pearson method: serum miR-122 (A), serum miR-375 (B), urine miR-940 (C) and miR-375 (D).

