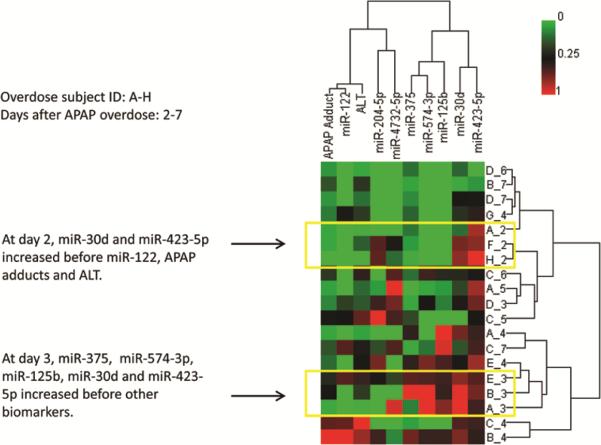
Figure 4. Clustering analysis of ALT, APAP adducts and miRNAs peak time from overdose subjects with multiple measures.
Overdose subjects were listed by alphabet (A-H) and days after APAP ingestion (day2 -7). For example, B_4 is sample collected from subject B at day 4 after APAP overdose. HCA analysis showing miR-122 peaks at similar time as ALT or APAP protein adducts, however, some miRNA levels precede those of ALT or APAP protein adducts.

