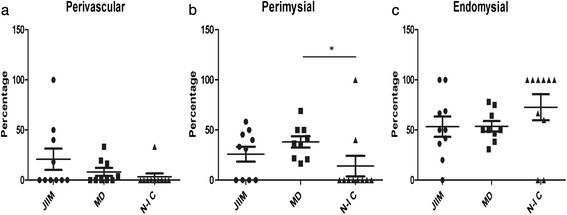
Fig. 3.

Percentage of microchimeric cells at various muscle locations. Data are presented as mean of the percentage ± standard error of the mean at each location for each diagnostic group. JIIM juvenile idiopathic inflammatory myopathy (n = 10), MD muscular dystrophy (n = 9), N-IC noninflammatory controls (n = 10). * p = 0.014. (a) Perivascular location; (b) Perimysial location; (c) Endomysial location
