Fig. 2.

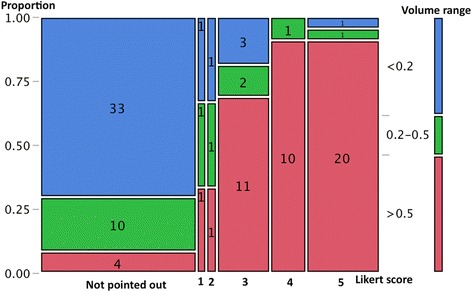
Mosaic plot of relationship between tumor volume and each assigned Likert score. The proportion of >0.5 cm3 tumors increased according to the upgrade of Likert scores (χ2 test, p < 0.0001)

Mosaic plot of relationship between tumor volume and each assigned Likert score. The proportion of >0.5 cm3 tumors increased according to the upgrade of Likert scores (χ2 test, p < 0.0001)