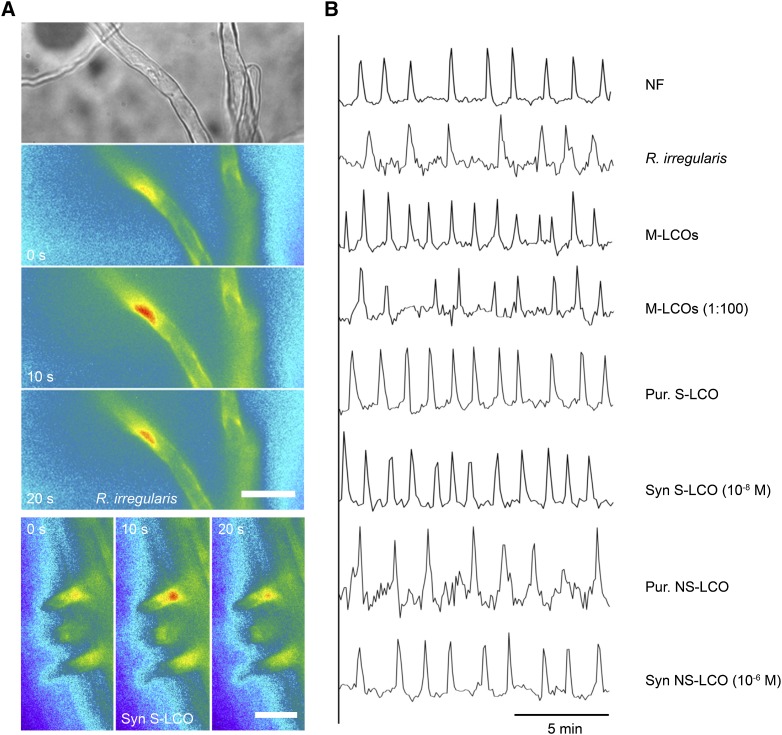
Figure 1.
Myc-LCO-Induced Calcium Responses in M. truncatula.
(A) Images showing a single calcium transient measured using the Yellow Cameleon calcium sensor in a trichoblast of M. truncatula in close proximity to R. irregularis (upper panels) and cells treated with S-LCO at 10−8 M (lower panels). Note that the calcium changes are restricted to the nuclear region. Bars = 50 μm.
(B) Representative traces of M. truncatula trichoblasts responding to Nod factor (NF), R. irregularis, and Myc-LCOs: the LCO mix (M-LCOs), fungal purified (Pur) S-LCOs and NS-LCOs, and synthetic (Syn) S-LCOs and NS-LCOs. The y axis is the ratio of YFP to CFP in arbitrary units.

