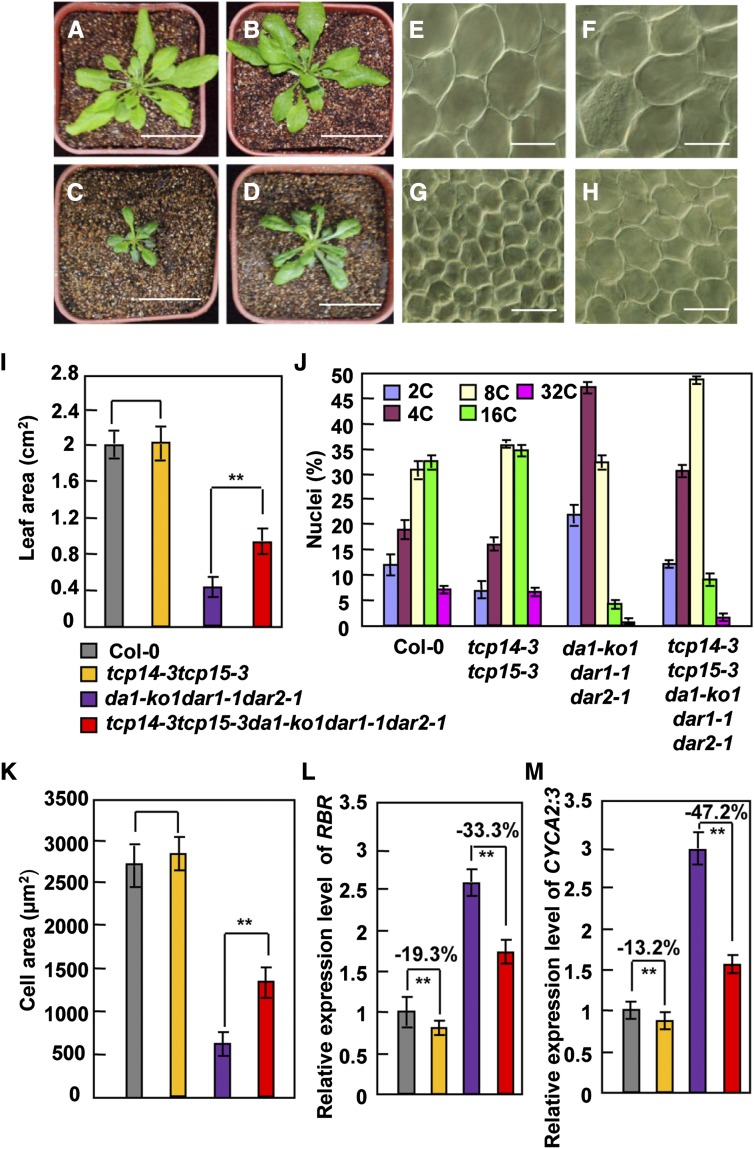
Figure 6.
DA1, DAR1, and DAR2 Act in a Common Pathway with TCP14/15 to Regulate Endoreduplication.
(A) to (D) Forty-day-old plants of Col-0 (A), tcp14-3 tcp15-3 (B), da1-ko1 dar1-1 dar2-1 (C), and tcp14-3 tcp15-3 da1-ko1 dar1-1 dar2-1 (D).
(E) to (H) Palisade cells in Col-0 (E), tcp14-3 tcp15-3 (F), da1-ko1 dar1-1 dar2-1 (G), and tcp14-3 tcp15-3 da1-ko1 dar1-1 dar2-1 (H) fifth leaves.
(I) Average area of Col-0, tcp14-3 tcp15-3, da1-ko1 dar1-1 dar2-1, and tcp14-3 tcp15-3 da1-ko1 dar1-1 dar2-1 fifth leaves.
(J) Distribution of nuclear ploidy in Col-0, tcp14-3 tcp15-3, da1-ko1 dar1-1 dar2-1, and tcp14-3 tcp15-3 da1-ko1 dar1-1 dar2-1 fifth leaves.
(K) Average area of palisade cells in Col-0, tcp14-3 tcp15-3, da1-ko1 dar1-1 dar2-1, and tcp14-3 tcp15-3 da1-ko1 dar1-1 dar2-1 fifth leaves.
(L) Expression levels of RBR in Col-0, tcp14-3 tcp15-3, da1-ko1 dar1-1 dar2-1, and tcp14-3 tcp15-3 da1-ko1 dar1-1 dar2-1 leaves.
(M) Expression levels of CYCA2;3 in Col-0, tcp14-3 tcp15-3, da1-ko1 dar1-1 dar2-1, and tcp14-3 tcp15-3 da1-ko1 dar1-1 dar2-1 leaves.
Values in (I) to (M) are given as means ± se. **P < 0.01 compared with the wild type (Student’s t test). Bars in (A) to (D) = 5 cm; bars in (E) to (H) = 50 μm.

