Figure 5.
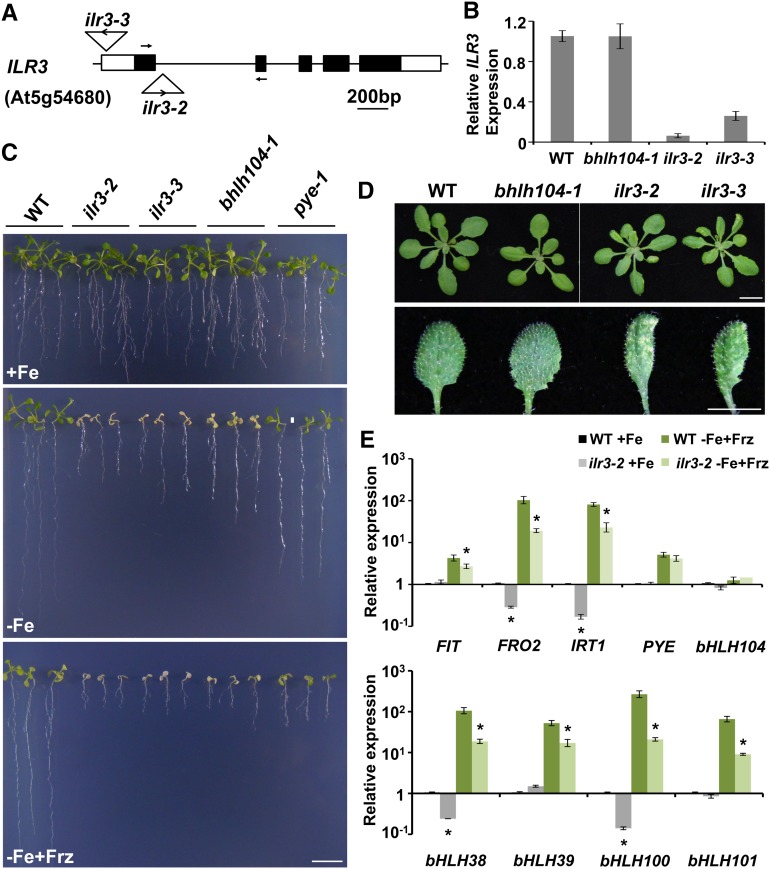
The ILR3 Knockout Mutants Show Sensitivity to Fe Deficiency and Decreased Expression of Fe Uptake-Related Genes.
(A) The position and orientation of the T-DNA insertion site for the ilr3-2 (Salk_004997C) and ilr3-3 (Salk_043690C) mutants.
(B) Determination of the relative ILR3 expression level in wild-type, bhlh104-1, ilr3-2, and ilr3-3 plants grown for 4 weeks in normal soil, assessed by qPCR. Primers used for amplification of ILR3 are indicated in (A). Values are means ± sd of three independent experiments.
(C) Phenotype of wild-type, ilr3-2, ilr3-3, bhlh104-1, and pye-1 mutants grown for 2 weeks on Fe-sufficient (+Fe) or Fe-deficient (−Fe and −Fe+Frz) media. Bar = 1 cm.
(D) Phenotypes of wild-type, bhlh104, and ilr3 mutants grown in normal soil for 4 weeks. The magnified picture of leaves shows interveinal leaf chlorosis of ilr3 mutants. Bars = 1 cm.
(E) The relative gene expression measured by qPCR in roots of wild-type and ilr3-2 plants grown on Fe-sufficient (+Fe) or Fe-deficient (−Fe+Frz) media for 8 d. The expression of TUB2 was used to normalize mRNA levels, and the gene expression level in the wild type under Fe-sufficient conditions was set to 1. The data represent means ± sd of three independent experiments. Significant differences from the corresponding wild type are indicated by an asterisk (P < 0.05), as determined by Student’s t test.

