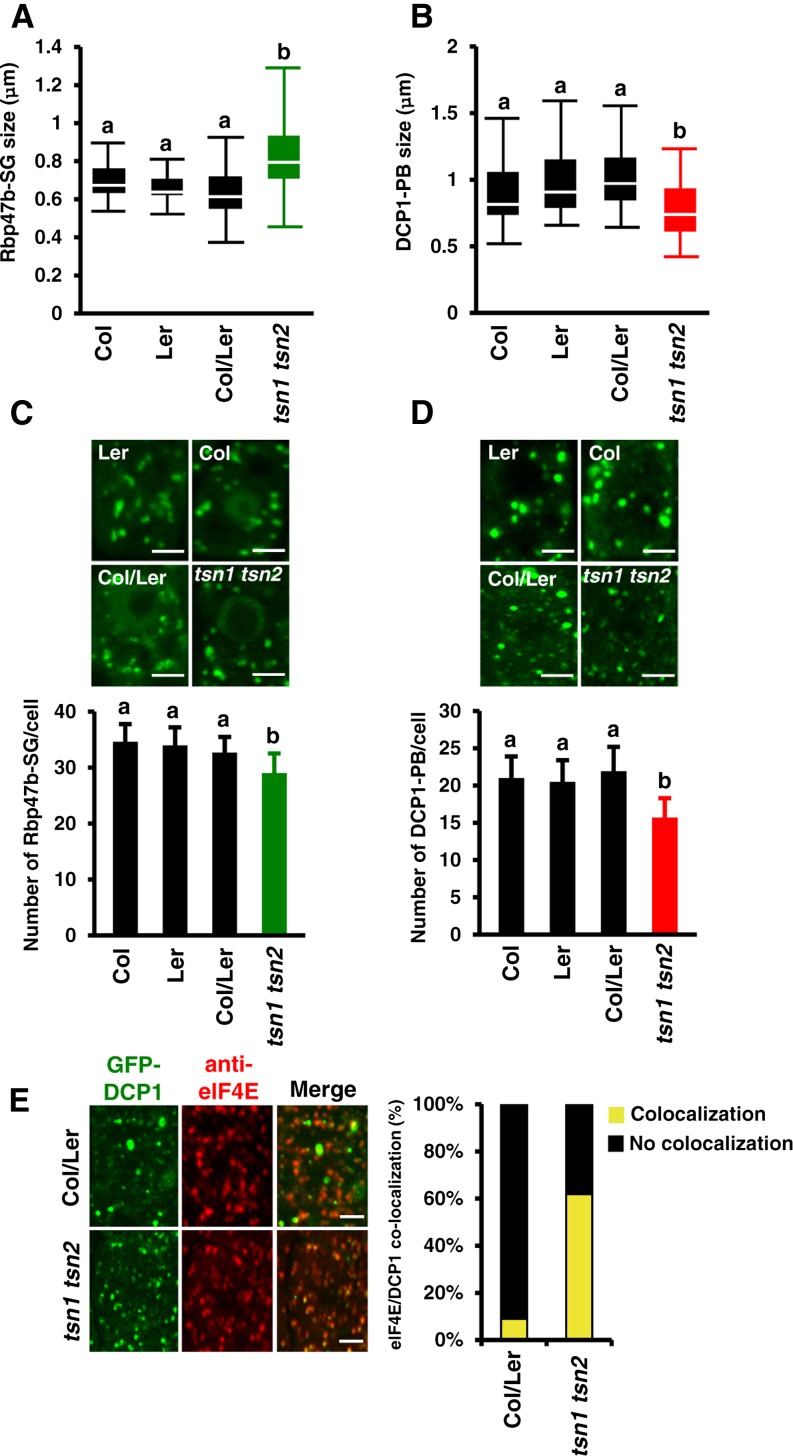
Figure 7.
TSN Deficiency Affects the Formation and Segregation of SGs and PBs.
(A) and (B) Box plots of the size (diameter) of GFP-Rbp47b (A) and GFP-DCP1 (B) foci in root tip cells of wild-type (Col, Ler, and Col/Ler) and tsn1 tsn2 seedlings expressing Pro35S:GFP-Rbp47b and Pro35S:GFP-DCP1, respectively, after heat stress (40 min at 39°C). Each box plot shows the median (solid line), the 25th and 75th percentiles (boxes), and the 5th and 95th percentiles (error bars).
(C) and (D) Formation of GFP-Rbp47b (C) and GFP-DCP1 (D) foci in root tip cells of wild-type (Col, Ler, and Col/Ler) and tsn1 tsn2 seedlings expressing Pro35S:GFP-Rbp47b and Pro35S:GFP-DCP1, respectively, after heat stress. The graphs show mean numbers ± sd of foci per cell counted in 5 to 10 plants in each triplicate experiment. Green and red columns correspond to the mutant background (tsn1 tsn2), while black columns correspond to wild-type backgrounds. Means with different letters are significantly different at P < 0.05, Student’s t test. Bars = 2 μm.
(E) Colocalization analysis of GFP-DCP1 (green) and eIF4E (red) in root tip cells of Col/Ler and tsn1 tsn2 seedlings expressing Pro35S:GFP-DCP1 after heat stress. The graph displays the frequency of colocalization of DCP1 and eIF4E in wild-type and tsn1 tsn2 plants. Bars = 2 μm.

