Figure 1.
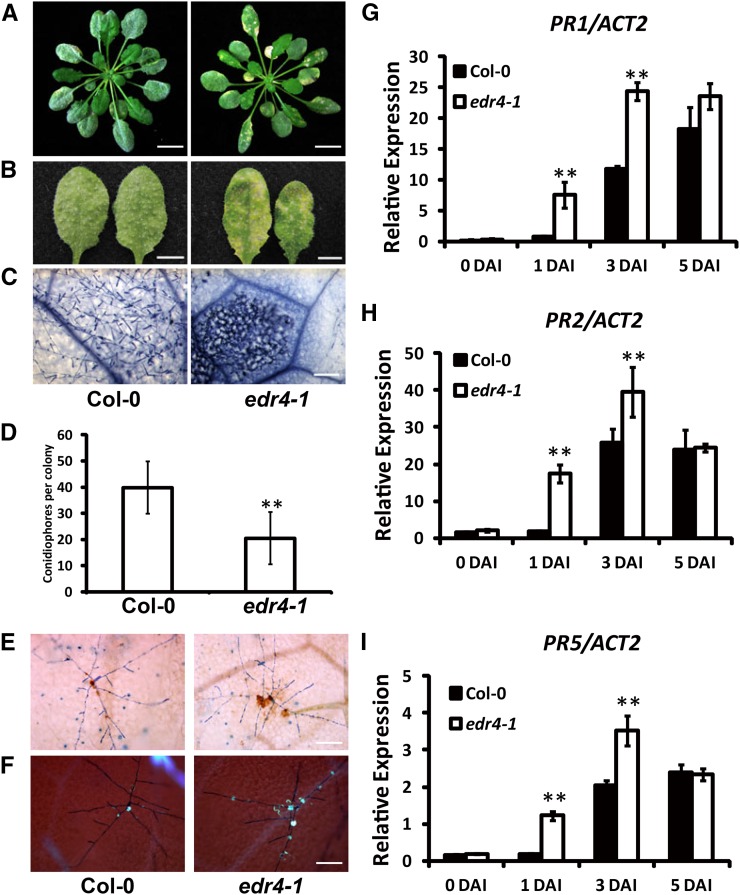
The edr4-1 Mutant Exhibited Enhanced Disease Resistance to G. cichoracearum.
(A) Four-week-old wild-type and edr4-1 plants inoculated with G. cichoracearum UCSC1. The photographs were taken at 8 DAI. Bars = 1 cm.
(B) Representative leaves removed from 4-week-old wild-type and edr4-1 plants inoculated with G. cichoracearum. The photographs were taken at 8 DAI. Bars = 0.5 cm.
(C) Trypan blue staining of the leaves shown in (B) to visualize fungal structures and plant cell death. Bar = 100 μm.
(D) Quantitative analysis of conidiophore formation on 4-week-old wild-type and edr4-1 plants at 6 DAI. The bars represent means and sd in one experiment (n = 20). The experiment was repeated three times with similar results. The asterisks indicate a statistically significant difference from the wild type (P < 0.01, Student’s t test).
(E) Trypan blue-DAB staining of 4-week-old wild-type and edr4-1 plants at 2 DAI with G. cichoracearum. Brown staining shows the accumulation of H2O2. Bar = 100 μm.
(F) Aniline blue staining of 4-week-old wild-type and edr4-1 plants at 2 DAI with G. cichoracearum to visualize callose deposition (blue dots). Bar = 100 μm.
(G) to (I) Four-week-old wild-type and edr4-1 plants were inoculated with G. cichoracearum. Relative transcript levels of PR1, PR2, and PR5 were examined at various time points using real-time PCR with ACT2 as an internal control. Bars represent means and sd of values obtained from three experiments. Asterisks indicate significant differences from the wild type (P < 0.01, Student’s t test).

