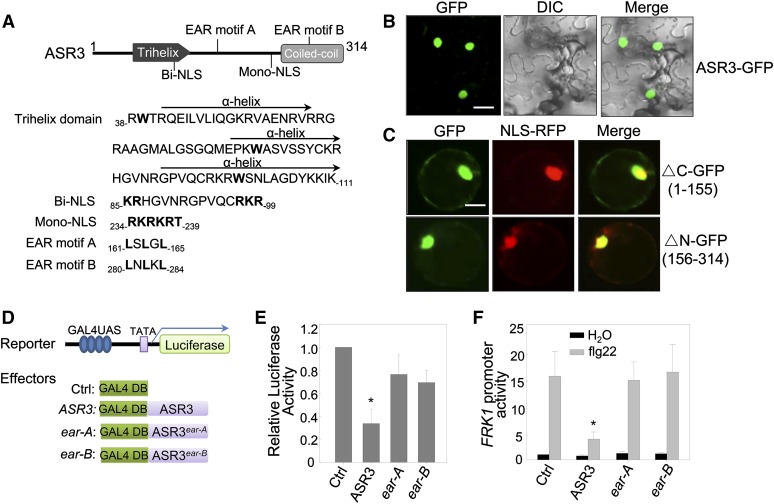
Figure 5.
ASR3 Is a Transcriptional Repressor.
(A) ASR3 is a putative trihelix transcription factor. The structure of ASR3 labeled with the putative protein motifs is shown on top, and the amino acid sequence with the starting and ending positions for each motif is shown below. The trihelix domain contains three amphipathic α-helices with the conserved Trp residues in bold. Bi-NLS and Mono-NLS stand for bipartite NLS and monopartite NLS, respectively. The bold letters in the sequence indicate the conserved sites in the motifs.
(B) ASR3-GFP localizes in the nucleus. N. benthamiana leaves were infiltrated with Agrobacterium tumefaciens carrying 35S:ASR3-GFP, and the images were taken 2 dpi with a confocal microscope. Bar = 20 μm.
(C) Both N-terminal and C-terminal halves of ASR3 localize in the nucleus. The GFP fusion of N-terminal half (△C) or C-terminal half (△N) was coexpressed with NLS-RFP in Arabidopsis protoplasts for 12 h and the images were taken with a confocal microscope. NLS-RFP is a control for nuclear localization. Bar = 10 μm.
(D) Schematic diagram of the effector and reporter constructs used in the transactivation assay. The reporter construct contains four copies of GAL4-UAS, a minimal 35S promoter (TATA), and a luciferase reporter gene. The effector constructs contain GAL4 DNA binding domain alone (Ctrl) or with ASR3 wild type or ear mutants under the control of 35S promoter.
(E) Relative transcriptional activity of ASR3 and ear mutants. Protoplasts were cotransfected with the reporter construct and different effector constructs.
(F) Overexpression of ASR3 in Arabidopsis protoplasts suppresses flg22-induced FRK1 promoter activity. Protoplasts were cotransfected with pFRK1:LUC and ASR3, ASR3ear-A, ASR3ear-B, or an empty vector control. In (E) and (F), UBQ10-GUS was included in all transfections and served as an internal transfection control. The luciferase activity was normalized with GUS activity. The data are shown as mean ± sd from three independent repeats. The asterisk indicates a significant difference with a Student’s t test (P < 0.05) when compared with control.
The above experiments were repeated three times with similar results.

