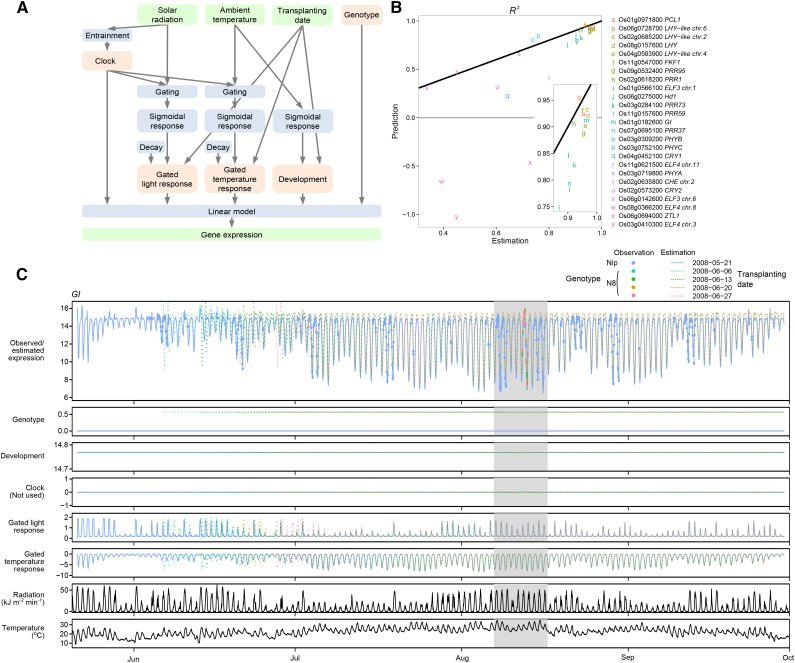
Figure 1.
Structure and Performance of the Gene Expression Model.
(A) Structure of the model. Observed variables (except for genotype) are in green, response processes in blue, and terms in pink.
(B) Estimation and prediction performance of the model for clock-related genes. R2, the fraction of variance explained by the model relative to variance of the data, was used as an index of fit for each gene model. Estimation performance was obtained with the same training samples (n = 461) as in (C). The black line indicates points where R2 values for estimation and prediction are equal. Prediction performance was obtained from validation samples (n = 108) collected in a different year. The genes are listed in order of rhythmicity evaluated as mutual information between the estimated gene expression and time of day (Supplemental Figure 3).
(C) The GI model as an example of estimated gene expression, inputs to the linear model, and observed gene expression. The shaded time interval is expanded in Supplemental Figure 4A. Nip, ‘Nipponbare’; N8, ‘Norin 8.’

